

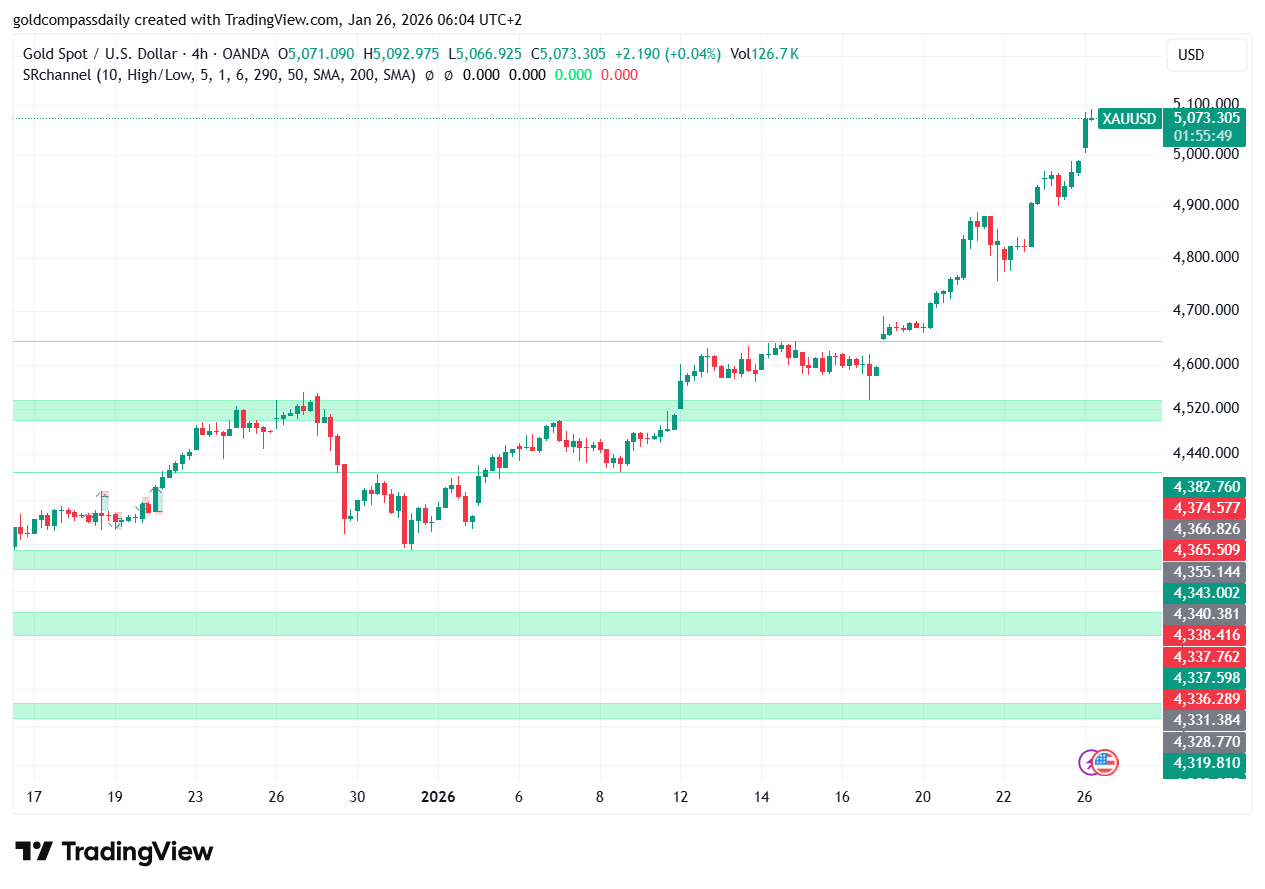
History has been made. On January 26, 2026, Gold (XAU/USD) decisively breached the $5,000 per ounce mark during the Asian session. This isn’t just a technical breakout; it is a fundamental shift in global asset allocation.
From Resistance to New Support
For weeks, the $5,000 level acted as a massive psychological barrier. Our 4-hour chart shows a parabolic move that ignored overbought RSI signals, fueled by heavy institutional accumulation. With the price currently trading near $5,073, the previous resistance at $5,000 is now expected to flip into the strongest support zone on the macro scale.
Why the $5,000 Level Matters
When an asset enters “Price Discovery,” there is no historical overhead supply (resistance). This often leads to rapid extensions. The current macro environment—characterized by a weakening dollar index and surging central bank demand in Asia and the Middle East—suggests that the $5,000 breach is just the beginning of a larger cycle.
Macro Targets for Q1 2026
With $5,000 reclaimed, the next institutional Fibonacci extension levels point toward $5,250 and $5,400. Traders should watch for a “retest and drive” pattern: a brief dip back to $5,000 to collect remaining liquidity before the next leg up.
Market Sentiment: Extreme Bullish. Institutional flow is bypassing traditional hedges in favor of physical and digital gold exposure.