

Weekly Thesis
Gold enters the week of July 20–24, 2026 at $4,017 — pinned at a critical inflection point after last week’s sharpest weekly decline in over a month dragged XAU/USD below $4,000 for the first time since November 2025, before a late Friday recovery clawed back above the psychological threshold. The week’s defining tension is straightforward: the structural forces that built gold’s record rally — central bank accumulation, fiscal expansion, and reserve diversification — remain firmly in place, but the near-term technical damage from a confirmed downtrend and a Fed that continues to flag inflation risks above target creates a precarious balance. The ECB’s monetary policy decision on Thursday and a full slate of global flash PMIs on Friday will determine whether gold’s hold above $4,000 represents a genuine base formation or merely a technical pause before a deeper correction toward $3,946.
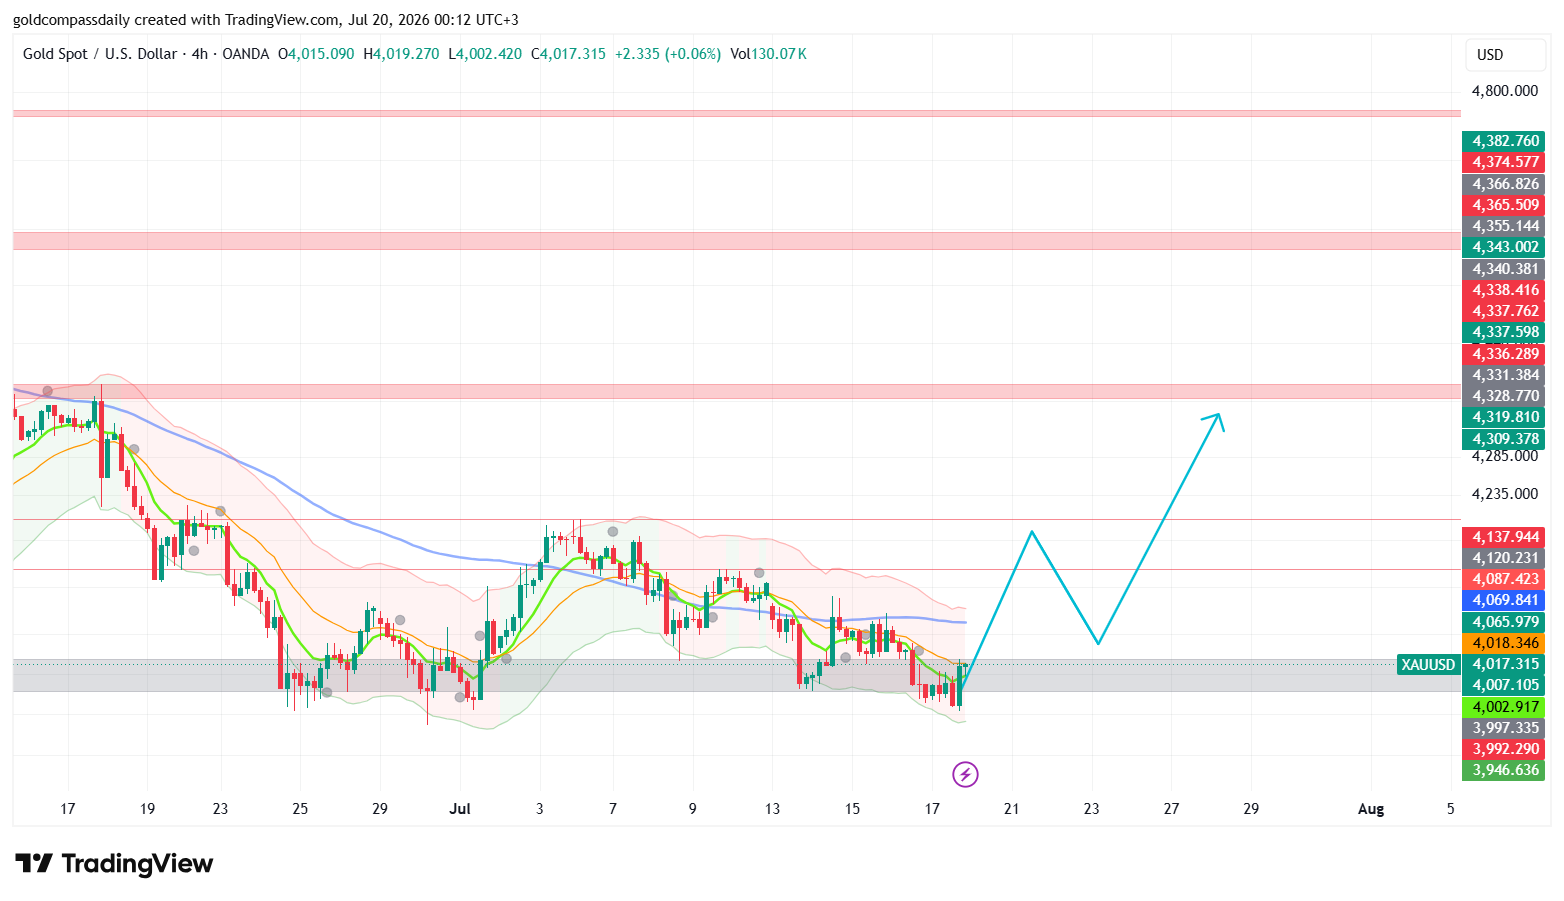
Key Levels for the Week
- Weekly bias: Cautiously Bullish above $4,003 — bulls need a confirmed hold and reclaim of $4,065 to shift momentum
- Immediate support: $4,002–$4,007 (current base / critical floor) → $3,992–$3,997 → $3,946 (chart demand zone)
- Key resistance: $4,065–$4,069 → $4,087–$4,120 → $4,137 (prior failed bounce high)
- Extended resistance cluster: $4,309–$4,319 → $4,328–$4,343 (major supply zone, multi-week target on recovery)
- Weekly bull target: $4,137–$4,150 (conditional on ECB hold with dovish language and soft flash PMIs)
- Weekly bear risk: $3,946 (conditional on ECB surprise hike, hawkish Lagarde press conference, or hot PMI data reigniting Fed rate-hike premium)
- The floor: $3,946 — break and close below = confirms the broader correction has a second leg lower targeting $3,800s
The Week’s Defining Event: ECB Rate Decision, Thursday July 23
Of all the scheduled events across five trading days, the European Central Bank’s monetary policy announcement on Thursday July 23 carries the greatest weight for gold this week — and not for the obvious reason. The decision itself is nearly certain to be a hold at 2.40% on the main refinancing rate, with market pricing from ING and UBS both pointing firmly toward no change following June’s hike. What matters for XAU/USD is the language that follows. ECB President Christine Lagarde’s press conference at 3:45 PM UTC will signal whether Frankfurt considers its tightening cycle complete or whether another hike remains live for September. A pause accompanied by genuinely neutral language — acknowledging that energy-driven inflation may be peaking — would weaken the dollar, compress real yields across the Atlantic, and give gold the fundamental catalyst it needs to break back above $4,065 and extend toward $4,137. Conversely, a hold accompanied by explicitly hawkish guidance — flagging persistent energy-price inflation and keeping September as an active meeting — would reinforce the narrative that the major central banks remain in synchronized restraint, sustaining dollar strength and capping any gold recovery attempt. The ECB meeting matters for gold this week precisely because it is the only event capable of shifting the macro narrative rather than confirming it.
Macro Context
Where Gold Stands After Last Week
The week of July 14–18 was defined by a sequence that initially looked gold-positive but ultimately proved insufficient to reverse the prevailing trend. June US CPI came in at 3.5% year-over-year, the first monthly decline since April 2020, and core CPI dropped to 2.6% — both readings below expectations and both technically reducing the urgency of a July Fed rate hike. Gold responded with an intraday bid that briefly pushed price back toward $4,030–$4,040. However, that relief rally collapsed within 24 hours as the macro picture complicated. US-Iran tensions escalated sharply, sending oil prices surging nearly 9% to monthly highs. Rather than acting as a safe-haven bid for gold, the energy shock renewed inflation fears, with Fed Chair Warsh, Governor Waller, New York Fed President Williams, and Dallas Fed President Logan all reiterating in separate appearances that inflation remains too elevated to justify any policy pivot. The market interpreted surging oil as a potential reversal of June’s CPI progress, boosting September rate-hike odds and crushing gold through $4,000 for the first time since November 2025. Friday’s session recovered the $4,000 handle, but XAU/USD closed the week down sharply — the metal’s worst weekly performance in more than a month — with the 4-hour chart confirming a series of lower highs and lower lows extending from mid-June.
The Macro Forces Shaping This Week
The fundamental backdrop for gold entering the week of July 20 contains two opposing currents of roughly equal force. On the bearish side: the Federal Reserve under Chair Warsh has established a clearly hawkish posture, Treasury yields remain elevated relative to the first half of 2025, the US dollar has regained strength on the back of rate-hike premium, and oil’s spike creates credible fear that June’s CPI softness was a one-month reprieve rather than a trend change. The June CPI and PPI cooling was driven primarily by a temporary decline in energy prices — a tailwind that has now reversed as Strait of Hormuz tensions push crude back toward monthly highs. This dynamic means that even with the CPI print technically dovish, the market cannot price out further Fed tightening with confidence, keeping real-yield pressure on non-yielding gold intact. On the bullish side: XAU/USD has now corrected approximately 28% from its January 2026 all-time high of $5,595, bringing it back toward valuations where the structural buyers — sovereign wealth funds, central banks, and reserve-diversification mandates — historically re-enter. China’s gold reserves rose at the fastest pace since 2023 during the recent price decline, a signal that institutional demand at these levels is real and not theoretical. The $4,000 level held as a weekly closing floor, which carries psychological significance in both market structure and media narrative terms.
Central Bank Context
The central bank picture entering this week is one of divergence with important implications for the dollar-gold relationship. The Federal Reserve holds its next scheduled meeting on July 28–29 — just outside this week’s window but close enough that every data print this week will be interpreted as FOMC input. Current market pricing assigns approximately 10% odds to a July hike, down from the 50% briefly reached ahead of the June CPI release, but the Fed’s own communications have been consistently hawkish, meaning those odds are fragile and data-dependent. The ECB holds 2.40% on its main refinancing rate after hiking in June, and as analysts at ING and UBS have noted, a hold at the July 23 meeting is the overwhelming base case — but the ECB’s forward guidance will carry more weight than the decision itself. If Lagarde signals that the tightening cycle is on pause while the Governing Council assesses whether energy inflation will persist, the resulting euro strength and dollar softness would be a net positive for gold priced in USD. A more hawkish ECB hold — explicitly keeping September on the table — would compound existing dollar strength. The Bank of Japan, meanwhile, is on a national holiday Monday, removing yen volatility from the early-week equation. Canada’s CPI data on Monday will be an early read on whether inflation pressure is easing across non-US economies, adding a secondary layer of macro context before the week’s main events arrive.
Daily Event Calendar
Monday, July 21 — UTC/UTC+3
- 04:00 UTC / 07:00 UTC+3 — CNY 1-Year and 5-Year Loan Prime Rate (forecast: 3.00% / 3.50% — hold): China’s LPR decision signals PBOC stance on monetary stimulus; a surprise cut would reflect demand concern and could modestly support gold via USD-weakness channel, though base case is no change.
- 12:00 UTC / 15:00 UTC+3 — CAD CPI m/m (forecast: -0.2%): Canada’s monthly inflation reading will be watched as a proxy for North American price trends; a softer-than-expected print would reduce cross-border rate-hike contagion risk and offer marginal gold support.
- 14:00 UTC / 17:00 UTC+3 — CAD Median CPI y/y (forecast: 2.1%) / Trimmed CPI y/y (forecast: 2.0%) / Common CPI y/y (forecast: 2.5%): The Bank of Canada’s core inflation suite completes the Monday inflation picture; readings at or below forecast suggest cooling price pressure in a G7 economy, gold-neutral to modestly positive.
- 17:00 UTC / 20:00 UTC+3 — USD CB Leading Index m/m (forecast: -0.1%): A continued decline in the Conference Board’s leading indicator would reinforce the narrative that the Fed’s restrictive policy is biting into forward economic activity, reducing the case for further rate hikes and providing a soft floor for gold.
Tuesday, July 22
- 08:30 UTC / 11:30 UTC+3 — GBP Claimant Count Change (forecast: 28.3K) / Average Earnings Index 3m/y (forecast: 4.5%) / Unemployment Rate (forecast: 4.9%): UK labour data is the primary data release of the morning session; elevated wage growth above 4.4% would extend the sterling-positive narrative and contribute to mild USD softening, indirectly supportive of gold.
- 09:00 UTC / 12:00 UTC+3 — EUR ZEW Economic Sentiment (forecast: 11.5) / German ZEW Economic Sentiment (forecast: 15.7): Eurozone and German forward-looking sentiment surveys; a print above forecast would suggest investor confidence in a European recovery narrative and could strengthen the euro ahead of Thursday’s ECB decision, providing mild USD headwind.
- 14:15 UTC / 17:15 UTC+3 — USD ADP Weekly Employment Change (forecast: 19.8K): Non-farm payroll preview; a reading below forecast would reduce Fed tightening concerns and is the most gold-relevant US data point of Tuesday’s session.
Wednesday, July 23
- 06:00 UTC / 09:00 UTC+3 — GBP CPI y/y (forecast: 2.7%) / Core CPI y/y (forecast: 2.5%): UK inflation data one day before the ECB decision; a softer read would reinforce the global inflation-peaking narrative that gold needs to confirm a base, while a hot print would sustain cross-Atlantic rate-hike concerns.
- 16:30 UTC / 19:30 UTC+3 — USD Crude Oil Inventories: Oil stock data provides a real-time read on energy demand dynamics; a surprise drawdown would push crude higher and reignite the inflation-rebound fear that drove gold’s sell-off last week — the most risk-negative scenario for gold mid-week.
Thursday, July 24 — Primary Event Day
- 13:15 UTC / 16:15 UTC+3 — EUR Main Refinancing Rate (forecast: 2.40% — hold) + Monetary Policy Statement: The ECB rate decision. A hold is nearly unanimous in market expectation; the statement’s language on future policy path is where the market reaction will be concentrated.
- 13:45 UTC / 16:45 UTC+3 — EUR ECB Press Conference (Lagarde): The single highest-impact event of the week for gold. Lagarde’s tone on energy inflation, the September meeting, and the Governing Council’s assessment of the eurozone growth-inflation balance will determine whether the euro strengthens or weakens — directly driving gold’s USD-denominated price reaction in the Thursday afternoon session.
- 14:30 UTC / 17:30 UTC+3 — USD Unemployment Claims (forecast: 211K): Weekly jobless claims as a real-time labour market barometer; a reading above 220K would be gold-positive by reducing Fed hawkishness; below 200K would compound rate-hike fears into the Thursday close.
- 14:30 UTC / 17:30 UTC+3 — CAD Core Retail Sales m/m (forecast: 1.4%) / Retail Sales m/m (forecast: 1.0%): Canadian consumption data; strong Canadian retail figures alongside an ECB hold could produce a multi-currency USD-softening effect, extending any gold recovery from the ECB reaction.
Friday, July 25 — Flash PMI Day
- 08:15–09:00 UTC / 11:15–12:00 UTC+3 — EUR French / German / Eurozone Flash Manufacturing and Services PMIs: The first comprehensive read on July economic activity across the eurozone; a services PMI above 50 in the bloc’s largest economies would complicate the ECB’s case for further tightening, euro-negative and potentially gold-negative via reduced USD pressure.
- 09:30 UTC / 12:30 UTC+3 — GBP Flash Manufacturing PMI (forecast: 52.1) / Services PMI (forecast: 49.4): UK PMI data; a services reading below 50 would confirm the UK services sector contraction narrative and could add to sterling weakness.
- 14:45 UTC / 17:45 UTC+3 — USD Flash Manufacturing PMI (forecast: 54.5) / Flash Services PMI (forecast: 51.4): The most gold-relevant PMI release of the week. A US manufacturing PMI above 54 alongside a firm services print would signal resilient economic momentum, keeping the Fed’s optionality for further tightening alive and capping gold on Friday. A miss on either — particularly services below 50 — would fuel rate-cut speculation and provide a late-week gold lift.
- 16:00 UTC / 19:00 UTC+3 — USD New Home Sales (forecast: 604K): Housing demand as a real-economy check on the impact of elevated mortgage rates; a miss would reinforce the economic-slowdown case, modestly gold-supportive.
Weekly Bull and Bear Scenarios
Bull Case — Target: $4,137–$4,150
The bull case requires three conditions to align in sequence across the week. First, Monday’s price action must hold $4,002–$4,007 on any early dip, confirming that the weekend recovery from sub-$4,000 lows is a genuine base and not a dead-cat bounce. Second, the ECB on Thursday must deliver a hold accompanied by language that either explicitly signals a pause in the tightening cycle or moderates Lagarde’s tone on energy-inflation persistence — a shift that would weaken the dollar, compress EUR/USD upward, and deliver a meaningful bid into gold during Thursday’s afternoon session. Third, Friday’s US flash PMIs must miss consensus on at least one of the two components — manufacturing below 54 or services approaching 50 — suggesting that Fed rate-hike optionality is eroding. Under this sequence, XAU/USD is positioned to reclaim $4,065–$4,069 by mid-week, push through $4,087–$4,120 on the ECB reaction, and test $4,137 into the Friday close. The chart path drawn by the analyst on the attached 4-hour chart — projecting an initial hold at current levels followed by an accelerating recovery into late July — aligns precisely with this sequence.
Bear Case — Risk: $3,946
The bear case does not require a dramatic catalyst — it requires the existing macro pressure to persist without relief. If the $4,002–$4,007 support cluster breaks on Monday or Tuesday, momentum selling could push XAU/USD through $3,992 and toward $3,946, the next defined demand zone on the 4-hour chart, within the first half of the week. The ECB adds tail risk: while a hold is the base case, a surprise 25-basis-point hike — which analysts at ING and UBS explicitly declined to rule out, citing energy-inflation persistence — would signal that the most recently hiking major central bank views inflation risks as unresolved. That outcome, combined with a continuation of Warsh’s hawkish Fed rhetoric ahead of the July 28–29 FOMC meeting, would re-accelerate the real-yield compression trade and expose $3,946 before the week ends. A further risk vector is oil: if Strait of Hormuz tensions escalate further and crude posts another significant weekly gain, the June CPI softness would be fully repriced by the market as transitory, and gold’s relief from the CPI report would be entirely unwound. In this scenario, the week closes below $3,992 with $3,800 in view as the next meaningful support.
This Week’s Daily Analysis
- Monday, July 20 — Gold opens the week at $4,017 holding a critical support cluster at $4,002–$4,007 after last week’s breach of $4,000 was reversed into Friday’s close. Canadian CPI and the CB Leading Index are the primary data inputs for the session. Price action around the $4,007 level into the North American open will set the tone for Tuesday.
- Tuesday, July 21 — UK labour market data and Eurozone ZEW sentiment surveys dominate the morning session. ADP weekly employment change provides the US afternoon data point. Gold will need to hold $4,007 and begin reclaiming $4,018–$4,030 to maintain the cautious bull structure.
- Wednesday, July 22 — UK CPI provides an inflation read one day before the ECB. Crude oil inventories in the afternoon are the highest-risk data point for gold mid-week, given energy prices’ role in last week’s sell-off. A hold above $4,018 into Wednesday’s close keeps the ECB recovery scenario intact.
- Thursday, July 23 — Primary event day. The ECB rate decision at 13:15 UTC and Lagarde’s press conference at 13:45 UTC are the week’s defining catalyst for gold. US unemployment claims complete the afternoon macro picture. The 13:45–15:30 UTC window is the highest-volatility period of the week.
- Friday, July 24 — Flash PMI day across the eurozone, UK, and United States. US manufacturing and services PMIs at 14:45 UTC are the final major data inputs for the week and the most significant for gold’s Friday close positioning ahead of the July 28–29 FOMC meeting.
Chart Analysis and Technical Structure
4-Hour Chart — Key Technical Observations
The 4-hour XAU/USD chart as of July 20, 2026 at 00:12 UTC+3 presents a market in a confirmed intermediate downtrend with the first credible signs of a base forming at the $4,000 psychological level. Price has established a series of lower highs and lower lows from the mid-June peak above $4,300 through the July 17–18 low near $3,992–$4,002. All three visible moving averages — the short-period green, the medium orange, and the longer-period blue — are positioned above current price and pointing lower, confirming the trend direction on the 4-hour timeframe. The blue moving average, functioning as a multi-week trend reference, sits approximately $130–$150 above current price near the $4,150 zone, a level that has twice acted as resistance on intraday rally attempts in July.
The support cluster at $4,002–$4,007 is the most important technical reference for the week. This zone has contained price on a closing basis across the most recent sessions, and a confirmed hold here — defined as two or more 4-hour closes above $4,007 — would shift the short-term structure from trend extension to potential base formation. Immediate resistance layers above are well-defined: $4,018–$4,030 is the first recovery target, with $4,065–$4,069 the more significant structural level that would need to be reclaimed for the bull case to gain traction. The failed bounce high at $4,137–$4,144 from early July represents the maximum weekly upside scenario, aligning with the upper end of the blue moving average’s near-term trajectory and the lower boundary of a heavier supply zone beginning at $4,309.
The Annotated Recovery Path
The chart carries an analyst-drawn projection showing the anticipated price path through the remainder of July and into early August. The projection maps a sequence consistent with the bull scenario outlined above: a hold at or near current $4,017 levels through the early part of the week, followed by a corrective dip that tests — but holds — the $4,002–$4,007 support base, then a recovery phase beginning mid-to-late week that accelerates through the $4,065–$4,087 resistance cluster and extends toward $4,309–$4,319 in the final week of July. This recovery target aligns with the next major resistance cluster visible on the right side of the chart, spanning $4,309 to $4,343, which corresponds to the supply zone that capped price in early-to-mid June before the extended decline. For the annotated path to remain valid, the $3,946 chart demand zone must not be breached on a closing 4-hour basis. A decisive break below that level would invalidate the recovery scenario entirely and shift the projection toward a deeper correction testing the $3,800 region.
What to Watch Beyond the Calendar
Two factors outside the formal event calendar warrant monitoring throughout the week. First, Middle East geopolitical developments — specifically any escalation or de-escalation in US-Iran tensions around the Strait of Hormuz — will directly move oil prices, which in turn will either amplify or neutralize inflation expectations relevant to both the Fed and ECB. An oil spike above last week’s highs would be unambiguously negative for gold this week by reigniting the rate-hike narrative. A reversal in crude, perhaps on ceasefire signals or reduced shipping disruption, would remove that headwind and allow the CPI-driven softening narrative to reassert itself. Second, Fed speakers throughout the week will continue to shape FOMC expectations ahead of the July 28–29 meeting. Any language softening from the previously hawkish quartet — Warsh, Waller, Williams, or Logan — would compress rate-hike odds and provide an asymmetric positive catalyst for gold that the formal calendar does not capture.
Gold Compass Daily also notes that COMEX registered gold inventory has declined to its lowest level since October 2024, down sharply from record highs seen in April 2025. While inventory movements are not immediate price drivers, a tightening in physical availability at current price levels adds a structural support element beneath the purely macro and technical analysis framework. Central bank demand — with China’s purchases accelerating at the fastest pace since 2023 — confirms that institutional buyers view current levels as an accumulation opportunity, even as short-term momentum remains bearish.
Linking to Last Week’s Analysis
For the macro framework that set up last week’s decline, including the CPI catalyst scenario and Fed Chair Warsh’s Congressional testimony analysis, Gold Compass Daily readers can review the prior weekly hub: Gold Week Ahead: July 13–17, 2026 — US CPI and Fed Chair Warsh Shape the Next Move. The CPI soft print that week provided the initial bullish catalyst that analysis anticipated, but the Middle East escalation and Fed officials’ hawkish response ultimately delivered the bearish outcome of the bear scenario.
Analysis based on the XAU/USD 4-hour chart as of July 20, 2026, 00:12 UTC+3. This article is for informational and educational purposes only and does not constitute financial advice.