

Gold trades cautiously at $3,982 on Friday, consolidating within a narrow $3,970–$4,001 channel after Thursday’s sharp sell-off from $4,075. All three moving averages remain in bearish configuration above spot price, capping recovery attempts, while the afternoon University of Michigan Consumer Sentiment and Inflation Expectations prints represent the final macro catalyst of the week and the primary determinant of whether gold breaks down or stages a meaningful bounce into the weekend.
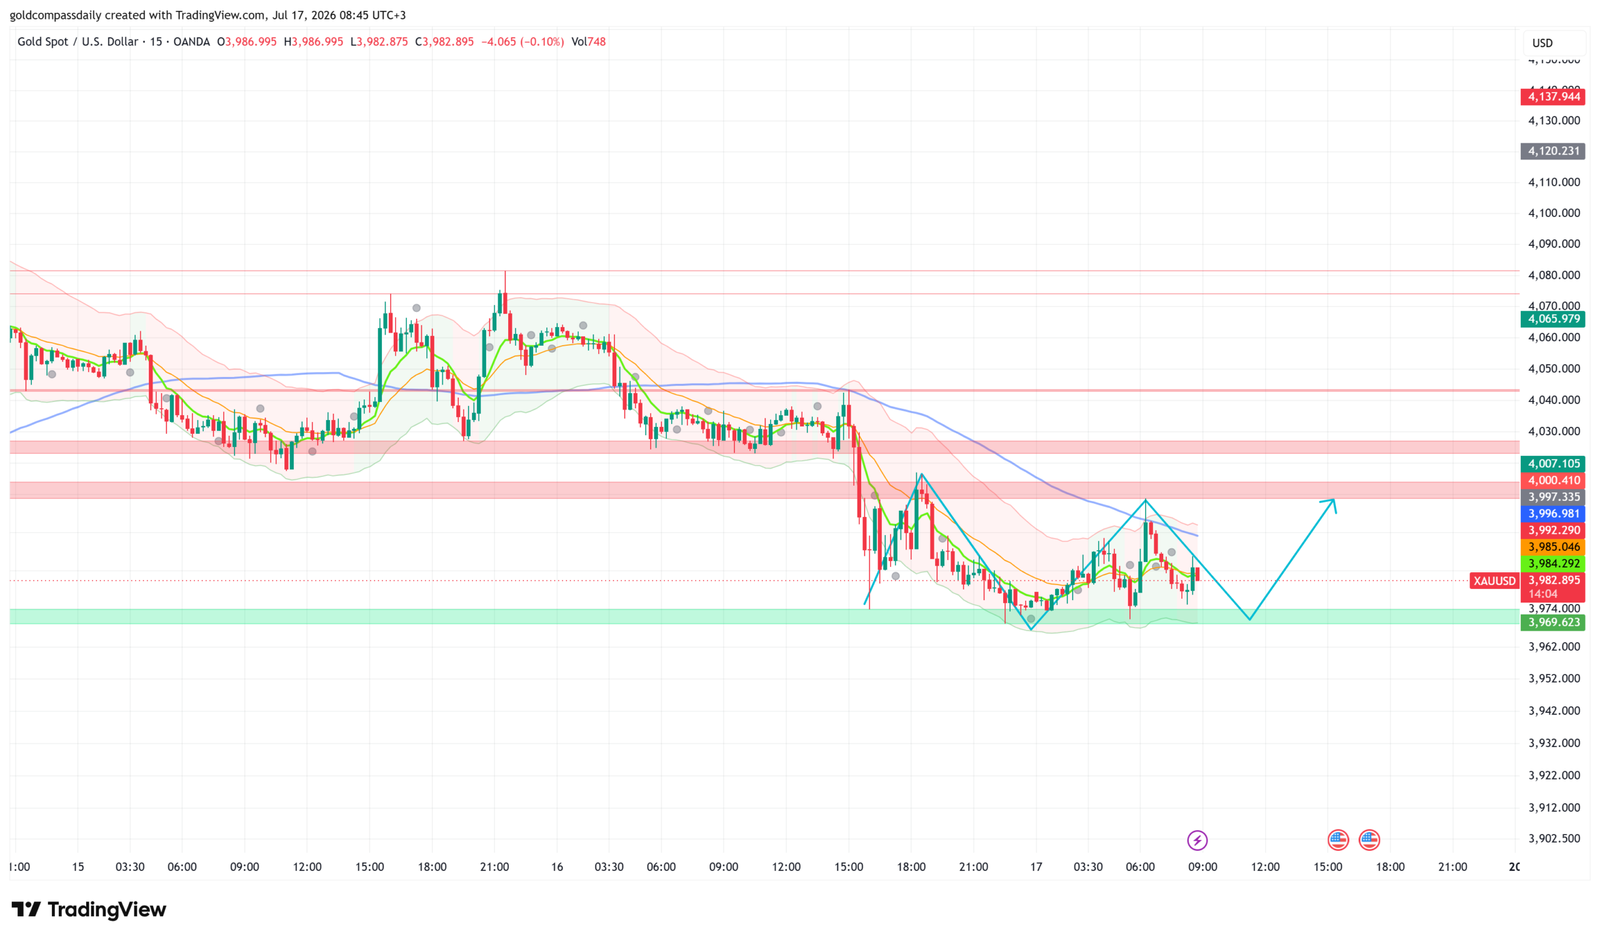
Key Levels
- Bias: Cautiously bearish below $4,001 — all moving averages sloping down and pressing from above
- Support: $3,974 → $3,969–$3,970 (channel floor, confirmed double-bottom low)
- Resistance: $3,984–$3,985 → $3,992–$3,997 → $4,000–$4,007
- Session target: $3,996–$4,000 (conditional on UoM sentiment miss and softer inflation expectations)
- Invalidation: Break and close below $3,969 = channel breach, opens $3,950–$3,955
Catalyst of the Day
The University of Michigan Preliminary Consumer Sentiment (forecast 51.0, prior 49.5) and accompanying Inflation Expectations data (prior 4.6%) at 17:00 UTC+3 are the pivotal events for Friday’s session. Consumer sentiment has deteriorated sharply in 2026 under sustained tariff pressure and cost-of-living stress, and inflation expectations running near 4.6% — well above the Fed’s 2% target — have kept the Federal Reserve’s hands tied. For gold, the calculus is direct: a sentiment beat accompanied by softening inflation expectations would reduce safe-haven and stagflation demand simultaneously, pressuring gold toward channel support. A miss on sentiment or a sustained inflation expectations print above 4.6% reinforces the stagflation premium that has driven gold’s multi-month advance, supporting a bounce toward $4,000. The Treasury Currency Report, also due tentatively Friday, carries a secondary tail risk — any designation language targeting trade partners could spike dollar volatility and create intraday whipsaws in gold.
Fundamental Context
Thursday’s import price data handed gold a mixed fundamental signal. Import prices fell sharply on a monthly basis, suggesting some pipeline disinflation in goods categories. However, the University of Michigan’s inflation expectations series — which measures what consumers expect to pay — has diverged persistently from headline import data throughout 2026, sustained by tariff pass-through fears. It is that expectations gap, not the import price read itself, that has kept real yields depressed and gold elevated above $3,900. Friday’s UoM release will clarify whether that expectations premium is beginning to compress or whether consumers remain entrenched in stagflation psychology.
On the housing front, Building Permits (1.40M, broadly in line) and Housing Starts (1.31M, above the 1.18M forecast) at 15:30 UTC+3 suggest the construction sector is holding up better than feared. Stronger housing starts reduce recession risk marginally but do not materially shift the gold thesis — gold’s current bid is driven by monetary policy uncertainty and geopolitical tension, not by cycle positioning. Industrial Production at 15:15 UTC+3 (forecast +0.2%) rounds out the pre-UoM dataflow but is unlikely to move gold independently. The earlier FOMC Member Jefferson speech and President Trump’s remarks carry event risk that could flare at any point during the Asian or early European session, though neither is expected to deliver a scheduled gold-relevant policy signal.
Chart Analysis
The 15-minute chart as of 08:45 UTC+3 shows gold trading at $3,982.895 after bottoming near $3,969–$3,970 on Thursday — a level that has now formed a clear double-bottom structure across two distinct tests. The green support zone at $3,969.623 marks the channel floor and has held on both occasions. Price is attempting a base-building consolidation between $3,974 and $3,985, but all three moving averages — green, yellow, and blue — are sloping firmly downward and positioned above spot price, maintaining bearish pressure. The projected path annotated on the chart shows a potential bounce attempt toward the $3,996–$4,000 cluster before a possible retest of the $3,970 floor, consistent with a range-bound consolidation scenario. Resistance levels stacked at $3,984–$3,985, $3,992–$3,997, $3,997–$4,007 form a dense supply zone that will require a material catalyst — specifically a soft UoM print — to clear. The $3,970 level remains the structural line in the sand for the week.
Bull / Bear Scenarios
Bull Scenario
Trigger: UoM Consumer Sentiment misses forecast (below 50.0) and/or Inflation Expectations hold above 4.7% → gold breaks above $3,997 resistance cluster on volume → initial target $4,007, extension target $4,025–$4,030 into weekend.
Bear Scenario
Trigger: UoM sentiment beats (above 52.0) and inflation expectations decline below 4.4% → gold fails to hold $3,974 on renewed selling → retest of $3,969–$3,970 channel floor → break below $3,969 opens $3,950–$3,955 as next structural support.
Events Ahead
- Friday 15:30 UTC+3 — USD Building Permits (1.40M forecast) & Housing Starts (1.31M forecast): above-forecast starts could marginally reduce recession risk; secondary gold impact only
- Friday 15:30 UTC+3 — USD Import Prices m/m (−0.7% forecast): goods disinflation data, context for the gap vs. consumer inflation expectations
- Friday 16:15 UTC+3 — USD Industrial Production m/m (+0.2% forecast): cycle health check; not a primary gold mover in isolation
- Friday 17:00 UTC+3 — USD Prelim UoM Consumer Sentiment (51.0 forecast, prior 49.5): primary catalyst — miss keeps stagflation premium alive; beat compresses safe-haven demand
- Friday 17:00 UTC+3 — USD Prelim UoM Inflation Expectations (prior 4.6%): co-primary — elevated read sustains real yield suppression; drop would pressure gold
- Friday Tentative — USD Treasury Currency Report: tail risk for dollar volatility and intraday gold whipsaws if designation language surprises
Gold Compass Daily’s full macro framework for the July 13–17 week, including the Fed Chair Warsh context and CPI-driven level structure, is available in the weekly hub article. Thursday’s session analysis, covering the $4,028 support test and the retail sales data reaction, is detailed in the prior session article. With the $3,969–$3,970 floor intact and UoM data due at 17:00 UTC+3, the session resolves into a binary: a soft sentiment read reopens $4,000, while a beat accelerates the channel breakdown toward $3,950.
New York Session Update
Price Check
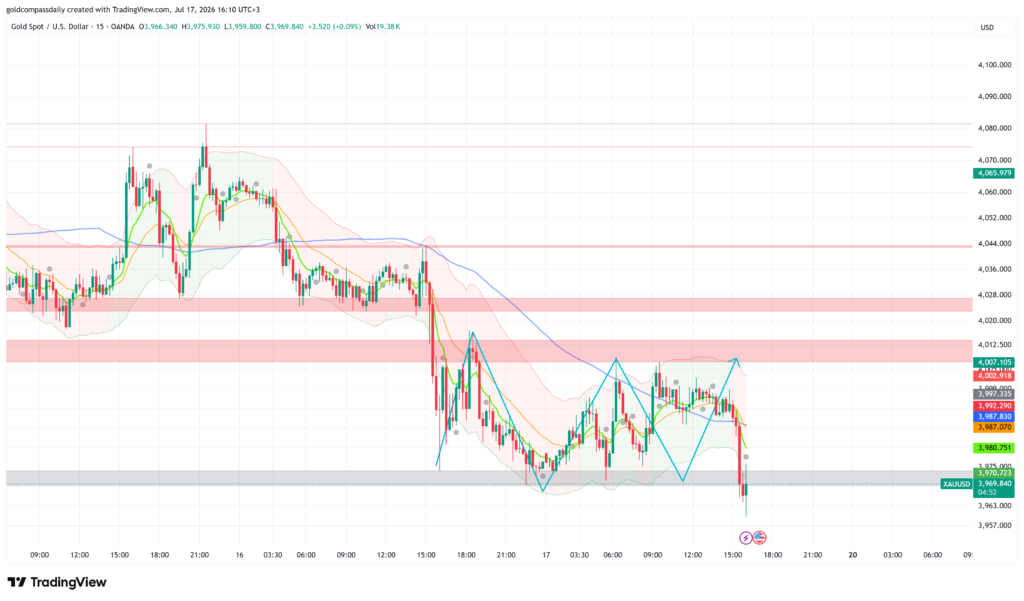
Gold has broken decisively below the $3,969–$3,970 channel floor identified in the morning analysis as the structural invalidation level, printing a session low of $3,959.80 before staging a partial recovery to $3,969.84 at 16:10 UTC+3. The morning’s hold thesis has been invalidated — the channel breakdown is confirmed.
What Changed
The University of Michigan Preliminary Consumer Sentiment printed at 61.8 for July versus the 51.0 forecast and the prior 49.5 — a sharp beat that removed the stagflation psychology premium underpinning gold’s bid. Inflation expectations also eased, reducing the real yield suppression trade that had kept gold elevated. The data hit at 17:00 UTC+3 and triggered an immediate and aggressive sell-off: price collapsed from the $3,987–$3,990 range through the $3,970 channel floor in a near-vertical move, briefly spiking to $3,957–$3,960 before a minor bounce. The $3,969–$3,970 zone — which held twice in the Asian session and formed the morning’s double-bottom structure — has now been breached and flipped to resistance. Volume spiked sharply on the breakdown candle, confirming institutional participation rather than a stop-hunt spike.
Updated Levels
- Current price: $3,969.84
- Bias now: Bearish — invalidation level breached; $3,970 now acting as overhead resistance
- Updated support: $3,957–$3,960 (session spike low) → $3,950–$3,952 (next structural zone)
- Updated resistance: $3,970.723 → $3,980.751 → $3,987.070–$3,987.830
- NY session target: $3,950–$3,952 on sustained trade below $3,969; recovery toward $3,980 if $3,970 is reclaimed on a closing basis
Scenarios Into the Close
Bull: Reclaim and close above $3,970 on a 15-minute candle with follow-through volume → initial recovery target $3,980.75, extension $3,987. Bear: Sustained hold below $3,969 through the NY afternoon — particularly on any second failure at $3,970 — confirms the breakdown and opens $3,950–$3,952 as the next downside objective.
Chart Analysis
The 15-minute chart as of 16:10 UTC+3 shows a decisive structural break. The cyan projected path from the morning — which anticipated a bounce toward $4,000 followed by a retest of $3,970 — was negated by the UoM data; instead of a controlled W-pattern recovery, price collapsed through the channel floor in a single aggressive move. All three moving averages (green, yellow, orange) have rolled sharply downward and remain above spot price, with the green MA confirming the latest bearish impulse. The blue longer-period MA continues its downward slope well above the current price range. The session low at $3,959.80 is the nearest reference support; a recovery candle is currently attempting to stabilize at $3,969, but that level has shifted from support to resistance and the burden of proof now sits with the bulls. Any close above $3,970 is the minimum requirement to re-engage the hold scenario; absent that, the path of least resistance into Friday’s close remains toward $3,950.
Analysis based on the XAU/USD 15-minute chart as of July 17, 2026, 08:45 UTC+3. This article is for informational and educational purposes only and does not constitute financial advice.