

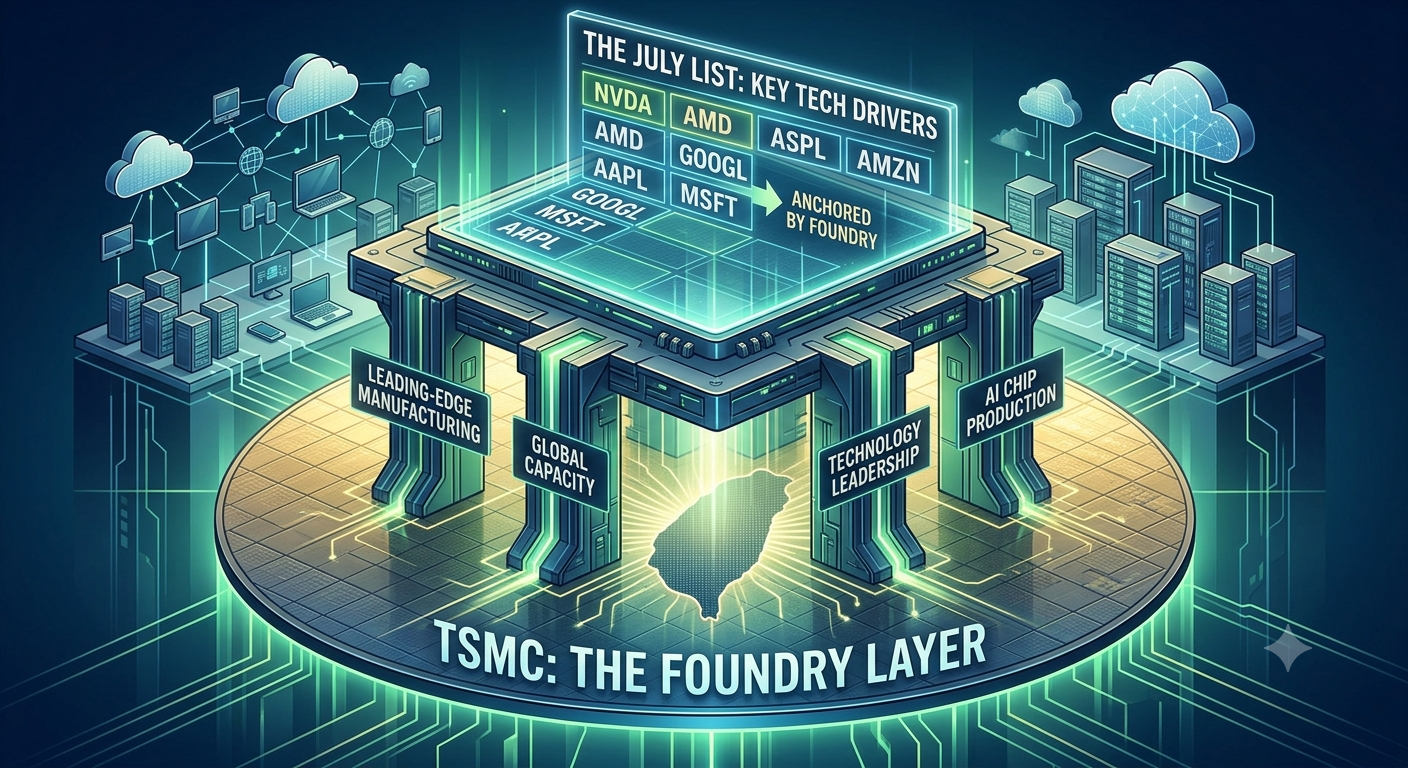
Taiwan Semiconductor Manufacturing Company (NYSE: TSM) was named the fourth selection in Gold Compass Daily’s Top 5 Stocks to Buy for July 2026 roundup, chosen for its position as the foundational manufacturer behind nearly every advanced AI chip in production today. Where Micron supplies memory and Vertiv and NextEra supply the infrastructure and power required to run data centers, TSMC manufactures the underlying logic chips, on behalf of Nvidia, AMD, Apple, and effectively every major fabless semiconductor designer, that make AI compute possible in the first place. As the dominant advanced-node foundry globally, TSMC occupies a position in the AI supply chain that has no meaningful substitute at scale, a structural advantage that shows up clearly in the analyst data reviewed below.
This deep-dive arrives at a particularly relevant moment: TSMC’s second-quarter 2026 results are scheduled for release on July 16, 2026, and the analyst data captured here reflects positioning immediately ahead of that report. This timing gives readers an unusually clear window into how the sell-side community was positioned heading into the print, including a notable divergence between a modest short-term earnings estimate and the company’s own recently raised full-year growth guidance.
Current Trading Context
TSMC shares were recently trading near $401.99, down 4.21% on the session. That decline places the stock well below the roughly $477 level it had approached in late June amid a string of pre-earnings analyst upgrades, and well below the Street-high price targets set by several major banks, including Barclays at $625 and Bank of America at $590, both issued in the weeks leading into the July 16 earnings date. Given the timing, this pullback appears connected to positioning around the second-quarter release, though as always, chart-accurate prices should take precedence over any single stated figure, and investors should confirm the live quote and any accompanying earnings commentary before drawing conclusions about the cause of the move.
Revenue Estimates: Sustained Growth Denominated in New Taiwan Dollars
TSMC reports its primary revenue figures in New Taiwan dollars, and the estimate table below reflects that currency convention rather than U.S. dollars, a detail worth keeping in mind when comparing these figures to other companies covered in this series.
- Current quarter (September 2026): 22 analysts covering, average estimate of NT$1.39 trillion, with a low estimate of NT$1.31 trillion and a high estimate of NT$1.45 trillion. That average implies year-over-year growth of 40.49% versus the NT$989.92 billion reported in the same quarter a year ago.
- Next quarter (December 2026): 21 analysts covering, average estimate of NT$1.47 trillion, ranging from a low of NT$1.37 trillion to a high of NT$1.67 trillion, representing implied growth of 40.39% over the NT$1.05 trillion reported a year earlier.
- Current year (2026): 38 analysts covering, average estimate of NT$5.21 trillion, with a low of NT$4.88 trillion and a high of NT$5.49 trillion, representing growth of 36.88% over the NT$3.81 trillion reported for the prior year.
- Next year (2027): 39 analysts covering, average estimate of NT$6.7 trillion, with a low estimate of NT$5.22 trillion and a high estimate of NT$7.6 trillion, implying growth of 28.55% over the current year’s projected base.
The consistency of the growth rate across the two nearest-term quarters, 40.49% and 40.39% respectively, is notable and suggests analysts see little quarter-to-quarter volatility in the underlying demand trajectory over the second half of 2026. That figure is also broadly consistent with TSMC’s own management guidance: at the company’s annual shareholder meeting in early June, CEO C.C. Wei raised the 2026 revenue growth forecast to more than 30%, up from an earlier estimate of 25% given in January, citing sustained AI infrastructure investment. The current-year analyst consensus of 36.88% growth sits comfortably above that raised guidance floor, suggesting the sell-side community has, if anything, built in expectations modestly ahead of the company’s own already-upgraded outlook.
Earnings Estimates: A Notably Thin Analyst Coverage Base
The earnings estimate table, denominated in U.S. dollars reflecting TSMC’s American Depositary Receipt structure, shows strong projected per-share growth, though it is worth flagging directly that the number of contributing analysts is considerably smaller than the revenue estimate table above, a detail that has implications for how much confidence to place in the precision of these particular figures.
- Current quarter (September 2026): 6 analysts, average EPS estimate of $4.26, with a low of $4.01 and a high of $4.60, compared with $2.92 in the same quarter a year ago.
- Next quarter (December 2026): 6 analysts, average estimate of $4.52, ranging from $4.14 to $4.90, versus $3.14 a year earlier.
- Current year (2026): 11 analysts, average estimate of $15.94, with a low of $14.74 and a high of $17.20, compared with $10.65 in the prior year.
- Next year (2027): 11 analysts, average estimate of $20.29, ranging from $18.71 to $23.75, versus the current year’s $15.94 base.
With only 6 analysts contributing current and next-quarter EPS estimates, compared with 22 and 21 analysts respectively contributing to the revenue estimates for the same periods, investors should treat the quarterly EPS figures as a somewhat less robust consensus than the revenue data, and place greater weight on the more broadly covered current-year and next-year annual figures, which draw on 11 contributing analysts each. The current-year estimate of $15.94, up from $10.65 a year earlier, implies earnings growth of approximately 49.7%, an unusually strong figure for a company of TSMC’s scale, and one that outpaces the 36.88% revenue growth estimate for the same period, indicating expected margin expansion alongside topline growth. The next-year estimate of $20.29 implies a further 27.3% increase, a still-robust but decelerating pace consistent with growing off a larger base.
Earnings History: A Confirmed Beat Streak With the Next Print Imminent
TSMC’s earnings history shows three consecutive quarters of positive surprises, with the fourth and most recent quarter, ended June 30, 2026, not yet reported as of this writing, its scheduled July 16, 2026 release date meaning results may already be public by the time this analysis reaches readers.
- Quarter ended September 30, 2025: EPS estimate of $2.63 versus actual of $2.92, a beat of $0.29, or an 11.23% positive surprise.
- Quarter ended December 31, 2025: EPS estimate of $2.98 versus actual of $3.14, a beat of $0.16, or a 5.53% positive surprise.
- Quarter ended March 31, 2026: EPS estimate of $3.33 versus actual of $3.49, a beat of $0.16, or a 4.68% positive surprise.
- Quarter ended June 30, 2026: EPS estimate of $3.89, with actual results and surprise percentage not yet available at the time this data was compiled.
The pattern here shows a gradual narrowing of the beat magnitude, from an 11.23% surprise in the September 2025 quarter down to a 4.68% surprise in the most recently completed quarter, a trend that suggests analyst models have been catching up to TSMC’s execution pace over time, converging toward a smaller but still consistently positive surprise. Whether that narrowing trend continues, holds steady, or reverses with the imminent June 2026 quarter print, against a current estimate of $3.89, will be one of the more immediately relevant data points for investors evaluating the stock in the days around this article’s publication. Readers should check for the actual reported figure separately, given how close the scheduled release date sits to the analysis presented here.
EPS Trend: Estimates Climbing Steadily Across Every Forward Period
The EPS trend table shows a consistent, broad-based upward drift in analyst estimates across all four forward periods over the trailing 90 days, a pattern that indicates growing analyst confidence in TSMC’s trajectory rather than a stable or plateauing consensus.
- Current quarter (September 2026): current estimate of $4.26, up from $4.25 seven days ago, $4.08 thirty days ago, $4.08 sixty days ago, and $3.91 ninety days ago.
- Next quarter (December 2026): current estimate of $4.52, up from $4.51 seven days ago, $4.35 thirty days ago, $4.35 sixty days ago, and $4.18 ninety days ago.
- Current year (2026): current estimate of $15.94, up from $15.91 seven days ago, $15.62 thirty days ago, $15.45 sixty days ago, and $14.78 ninety days ago.
- Next year (2027): current estimate of $20.29, essentially unchanged from $20.29 seven days ago, up from $19.53 thirty days ago, $19.29 sixty days ago, and $18.34 ninety days ago.
Over the full 90-day window, the current-quarter estimate has risen approximately 9.0%, the next-quarter estimate approximately 8.1%, the current-year estimate approximately 7.8%, and the next-year estimate approximately 10.6%. Unlike the pattern seen in some other names covered in this series, where the bulk of estimate revision occurred in a concentrated burst around a single earnings release, TSMC’s revisions appear to have built more gradually and steadily across the full quarter, consistent with a business whose growth trajectory has been increasingly well understood and telegraphed by management, including the CEO’s guidance raise at the June shareholder meeting, rather than one subject to sudden surprise-driven re-ratings.
EPS Revisions: Narrow but Entirely One-Directional
The EPS revisions table shows a smaller number of total analyst actions than some other names in this series, a natural consequence of the thinner EPS coverage base discussed above, but the directional signal is unambiguous: every single recorded revision across all four forward periods has been upward, with zero downward revisions recorded in either the trailing 7-day or 30-day windows.
- Current quarter: 1 analyst raised estimates in the last 7 days and 3 in the last 30 days, with zero analysts lowering estimates in either period.
- Next quarter: 1 analyst raised estimates in the last 7 days and 3 in the last 30 days, with zero analysts lowering estimates in either period.
- Current year: 2 analysts raised estimates in the last 7 days and 3 in the last 30 days, with zero analysts lowering estimates in either period.
- Next year: 2 analysts raised estimates in the last 7 days and 4 in the last 30 days, with zero analysts lowering estimates in either period.
While the absolute number of analysts involved is modest, reflecting TSMC’s smaller EPS-specific coverage panel relative to its much larger revenue-focused coverage base, the complete absence of any downward revision across every single period and window examined is a meaningfully clean signal. Combined with the steady upward drift documented in the EPS trend table above, this indicates a coverage community that has been consistently, if gradually, raising expectations, with no dissenting analysts pulling in the opposite direction over the periods captured.
Growth Estimates Versus the S&P 500: A Wide and Sustained Premium
The growth estimate comparison against the broader index shows TSMC’s expected earnings growth running at more than double the S&P 500’s pace across every period examined, a gap that, unlike some more extreme AI supply chain comparisons, remains within a range that a company of TSMC’s scale and profitability has demonstrated a credible path to sustaining.
- Current quarter growth: TSMC at 45.90% versus the S&P 500 at 21.09%.
- Next quarter growth: TSMC at 43.92% versus the S&P 500 at 21.98%.
- Current year growth: TSMC at 49.71% versus the S&P 500 at 23.64%.
- Next year growth: TSMC at 27.26% versus the S&P 500 at 18.31%.
The current-year figure of 49.71% is the standout number in this table, representing growth more than double the index’s 23.64% estimate, and it is worth noting this figure aligns closely with the roughly 49.7% earnings growth rate calculated independently from the earnings estimate table earlier in this article, a useful internal consistency check across the different data sets reviewed. The deceleration to 27.26% for next year, while still comfortably ahead of the index’s 18.31% estimate, reflects the natural mathematics of growing off a much larger current-year base rather than any indication of a structurally slowing business, particularly given that management’s own guidance and the steady upward EPS trend documented above both point toward continued strength rather than deceleration concerns.
The Structural Catalyst: Foundry Dominance in the Advanced-Node Era
TSMC’s position in the global semiconductor supply chain is effectively without a direct peer at its current scale. The company holds an estimated 70% share of the global dedicated foundry market, and advanced technologies, defined as chips built on 7-nanometer processes or smaller, now account for roughly three-quarters of the company’s total wafer revenue, reflecting a business mix that has shifted decisively toward the highest-margin, highest-demand segments as AI accelerator manufacturing has scaled.
First-quarter 2026 global foundry market data showed sector-wide revenue up 23% year over year to $86 billion, with TSMC alone posting 41% revenue growth and capturing the largest share of that expansion, meaning the company is not simply riding a rising tide but actively gaining relative share within an already-growing market. That combination, a large and growing total addressable market alongside continued share gains within it, is the structural underpinning for the sustained double-digit-to-near-50% growth rates documented throughout the estimate tables above.
Ahead of the July 16 earnings date, a wave of analyst commentary reinforced this positive framing. Barclays raised its price target to $625 from $470 while maintaining an Overweight rating, citing capital expenditure estimates of $56 billion for 2026 and $74 billion for 2027, and named TSMC a top pick heading into earnings alongside SK Hynix, ASML, and ASM International. Bank of America separately lifted its target to $590 from $490, citing growing demand tied to agentic AI applications, a newer category of AI workload that several analysts have flagged as an incremental demand driver beyond the initial wave of large language model training investment. UBS has separately projected TSMC could raise advanced-process pricing by 5% to 10% as early as the first quarter of 2027, a potential structural tailwind for margins that has resonated with investors positioning ahead of the current earnings cycle.
Risks Investors Should Weigh
Several risks are worth weighing directly, and the timing of this analysis, immediately around TSMC’s July 16 earnings release, makes some of them especially pertinent in the near term.
The most immediate is earnings-date volatility itself. The 4.21% single-session decline noted in the current trading context above occurred in close proximity to the scheduled July 16 report, and semiconductor stocks with TSMC’s valuation and growth expectations already embedded in the share price can react sharply, in either direction, to even modest deviations from consensus figures like the $3.89 current-quarter EPS estimate discussed above. Readers should treat any single-day price move around this date with appropriate caution until the underlying earnings commentary and updated guidance are available in full.
Geopolitical concentration risk represents a second, more structural concern. TSMC’s manufacturing base remains overwhelmingly centered in Taiwan, and any escalation in regional tensions carries potential implications for the company’s operations that are largely outside its own control. While TSMC has been diversifying manufacturing capacity to other regions over time, the substantial majority of its most advanced production remains concentrated domestically.
Capacity constraints and evolving customer relationships represent a third risk. Periodic reports have indicated that major customers, including AMD, Google, and BYD, have explored supplementary foundry relationships with Samsung, TSMC’s primary competitor at the leading edge, as a hedge against potential capacity limitations or geographic concentration concerns. While TSMC’s technology leadership and scale currently make it the preferred partner for the most demanding advanced-node work, any material shift in customer allocation toward alternative foundries over a multi-year horizon would represent a headwind to the sustained growth rates currently embedded in analyst estimates.
Finally, valuation has expanded meaningfully alongside the stock’s rally over the past year, and some independent valuation models have flagged the shares as trading at a premium to calculated intrinsic value estimates even after accounting for the company’s genuinely superior growth profile. The thinner analyst coverage base for the specific EPS estimates discussed above, just 6 contributing analysts for the nearest-term quarters, also means those particular figures carry somewhat wider potential for revision in either direction compared to the more broadly covered revenue estimates, a nuance worth keeping in mind when assessing the precision of near-term earnings expectations.
How TSMC Compares to Its Foundry Peers
Context from the broader foundry competitive landscape helps explain why analysts have been willing to assign TSMC such a substantial valuation premium relative to the semiconductor sector more broadly. Samsung, the next-largest advanced-node foundry operator, has faced well-documented quality and yield challenges in ramping its own high-bandwidth memory and advanced logic production, alongside labor tensions that some analysts believe could further constrain its manufacturing output. Intel, historically a leading-edge manufacturer in its own right, has been rebuilding its foundry services business from a much smaller base and has yet to demonstrate consistent leading-edge process parity with TSMC at meaningful commercial scale. This competitive backdrop means that even as customers like AMD, Google, and BYD explore supplementary foundry relationships as a hedge, discussed in the risks section above, the practical alternatives available to them for the most demanding advanced-node work remain limited in the near term, reinforcing TSMC’s pricing power and order book visibility.
This dynamic is reflected directly in the capital expenditure figures cited by Barclays above, $56 billion for 2026 and $74 billion for 2027. Capital spending of that magnitude is not a decision undertaken lightly by any semiconductor manufacturer, and the fact that TSMC’s own guidance calls for a substantial year-over-year increase in capital intensity signals management’s own confidence that current demand levels, and the pricing power that accompanies them, are durable enough to justify the investment. This capital spending trajectory also functions as a natural barrier to entry for potential future competitors, since matching TSMC’s scale would require a similarly enormous and sustained capital commitment over many years, a threshold that has already deterred additional new entrants from attempting to compete at the leading edge.
Putting the Case Together
TSMC’s inclusion in Gold Compass Daily’s July 2026 list rests on a combination of structural market dominance, a foundry share estimated at 70% globally and rising in the specific advanced-node segments that matter most for AI chip production, and a set of analyst estimates that have moved steadily and exclusively upward over the trailing 90 days without a single recorded downward revision across any period examined. The consistency between management’s own raised guidance, sell-side revenue and earnings estimates, and the relative growth premium over the broader index all point toward a well-supported, multiply-confirmed growth thesis rather than one resting on any single optimistic data point.
At the same time, the proximity of this analysis to TSMC’s July 16 earnings release means investors should treat near-term price action with particular care, given the potential for sharp moves around the print itself, and should weigh the geopolitical concentration risk inherent in TSMC’s Taiwan-centered manufacturing base as a longer-term consideration that sits alongside, rather than replaces, the company’s currently dominant competitive position. For investors seeking direct exposure to the manufacturing chokepoint of the global AI chip supply chain, the depth and consistency of the data reviewed above make a clear case for TSMC’s place among this month’s top selections.
For the full context on how TSMC fits alongside the other four names selected for July, including Micron Technology, Vertiv Holdings, NextEra Energy, and AbbVie, see the complete roundup: Top 5 Stocks to Buy for July 2026: AI, Power, Pharma.
Disclaimer
This article is provided for informational purposes only and does not constitute investment advice, a recommendation, or a solicitation to buy or sell any security. Prices, analyst estimates, and revision data referenced above reflect figures available as of mid-July 2026, immediately ahead of TSMC’s scheduled July 16, 2026 earnings release, and are subject to change without notice once that report is published. Past performance is not indicative of future results. Readers should conduct their own due diligence and consult a licensed financial advisor before making investment decisions.