
The 4-hour (4H) chart for Gold (XAU/USD) is currently painting a picture of absolute dominance. After weeks of consolidation, the breakout above the $5,000 psychological level has transitioned into a “parabolic” phase, leaving short-sellers on the sidelines.
Technical Breakdown of the 4H Timeframe:
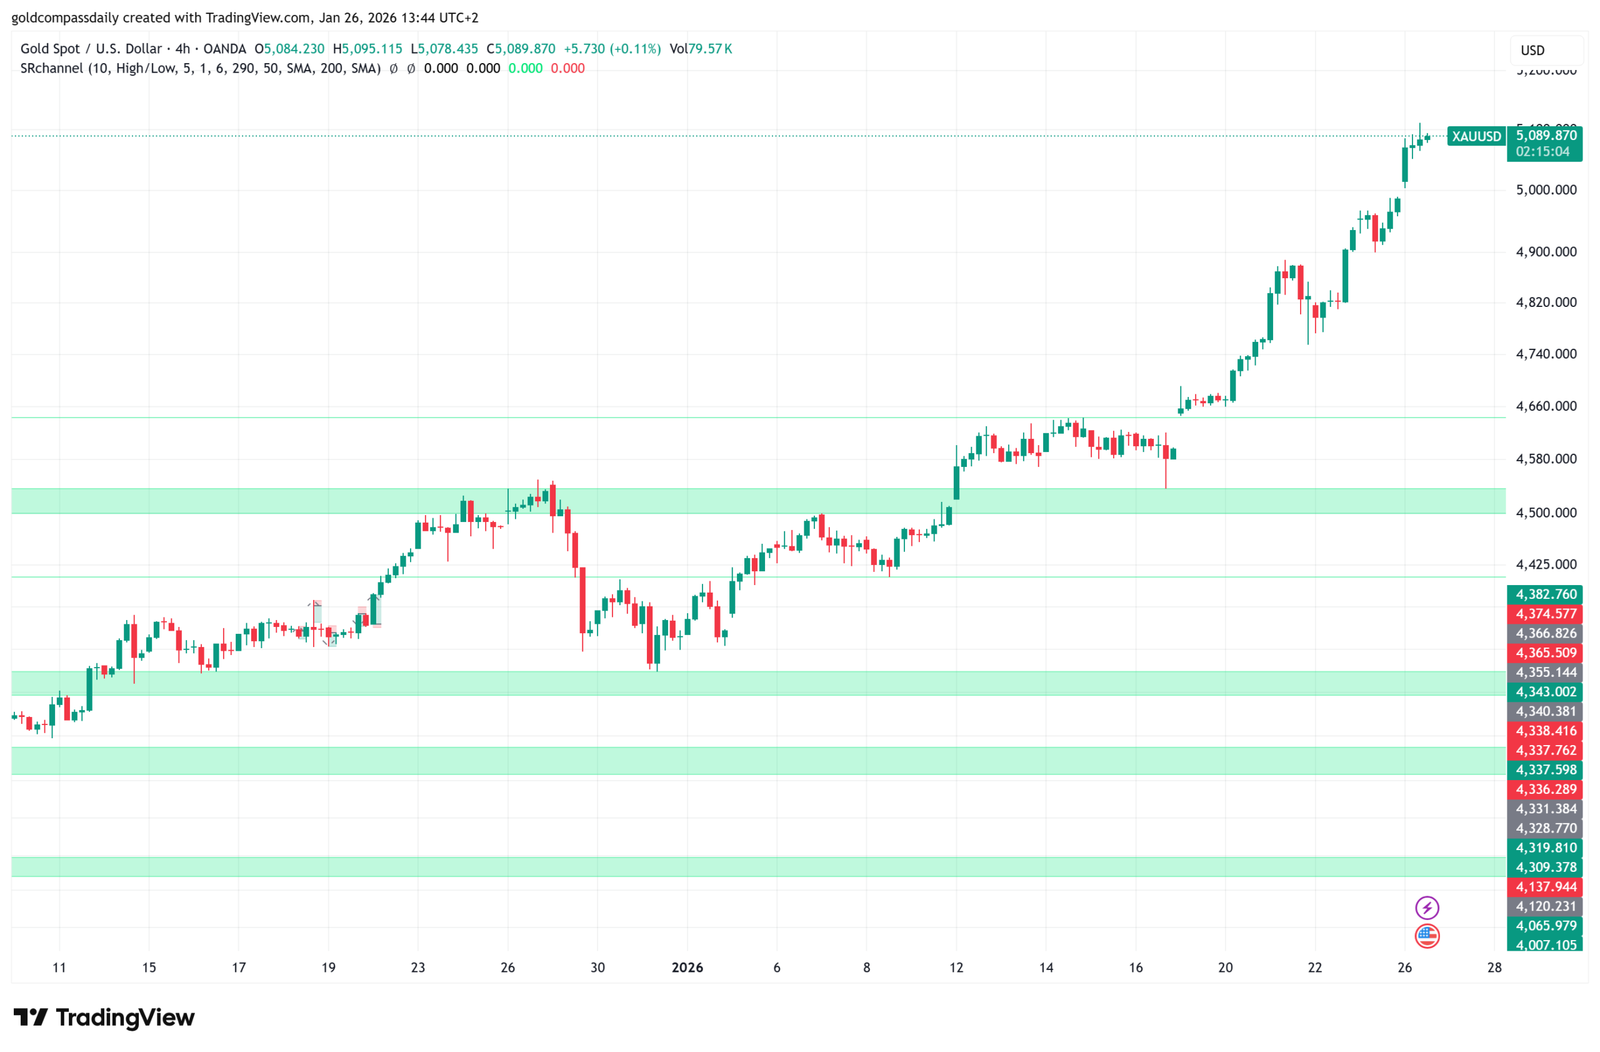
- Price Discovery: Since clearing the $5,000 mark, Gold has entered a “Price Discovery” zone. With no historical price action above these levels, the market is purely driven by momentum and institutional order flow.
- The $5,089 Support: As seen on the recent 4H candles, the price is holding remarkably steady around $5,089.87. Each 4-hour close above $5,050 further solidifies the bullish case.
- Moving Averages: The gap between the current price and the 50-period Moving Average is widening, suggesting extreme strength but also calling for caution regarding a potential “mean reversion” or a healthy correction.
Key Levels to Watch:
On this timeframe, the immediate upside target remains the $5,120 – $5,135 range. On the downside, a retest of the $5,000 – $5,020 zone would now be considered a “Golden Buy” opportunity for those who missed the initial breakout.
“The velocity of this move on the 4H chart suggests that institutional ‘FOMO’ (Fear Of Missing Out) has kicked in. We are seeing massive volume supporting every minor dip.”
Conclusion: The 4-hour trend is aggressively bullish. Unless we see a close back below $4,980, the path of least resistance remains firmly to the upside as we head into the high-impact U.S. economic data releases.