
As we navigate through the high-volatility environment of the current year, a comprehensive Gold Analysis 2026 is essential for any trader looking to maintain a competitive edge. The precious metal has shown remarkable resilience, but the recent price action suggests a complex interplay between macroeconomic shifts and technical profit-taking. To succeed in this market, one must align the long-term trend with short-term execution, creating a synchronized trading plan that accounts for every market heartbeat.


The Macro View: Understanding the 4-Hour Correction
Our Gold Analysis 2026 begins with the structural “big picture.” On the 4-hour chart, gold has entered a necessary cooling-off period after reaching historic peaks. This retracement isn’t just a technical fluke; it is a fundamental recalibration as the market digests the latest PPI and GDP data. Identifying the major support zones is critical here, as they define the health of the overall bull run.
For a deep dive into the higher-timeframe structures and the $5,100 targets, see our full Gold Price Correction: 4-Hour Pullback Analysis. Understanding these levels allows you to trade with the “wind at your back,” knowing exactly where the major institutions are likely to step back in.
Intraday Dynamics: The 1-Hour Battle for Control
Moving lower into the 1-hour timeframe, our Gold Analysis 2026 focuses on the intraday “pivot” zones. This is where the battle for the $5,200 level is currently being fought. The 1H chart serves as the bridge between macro sentiment and micro execution. It filters out the noise of the smaller timeframes while providing more timely entries than the 4-hour candles.
The current struggle to reclaim key moving averages suggests a market in hesitation. You can find the specific intraday targets and pivot points in our Gold Price Outlook: 1-Hour Technical Breakdown. Mastering the hourly chart is the key to identifying high-probability swing trades that last from a few hours to a couple of days.
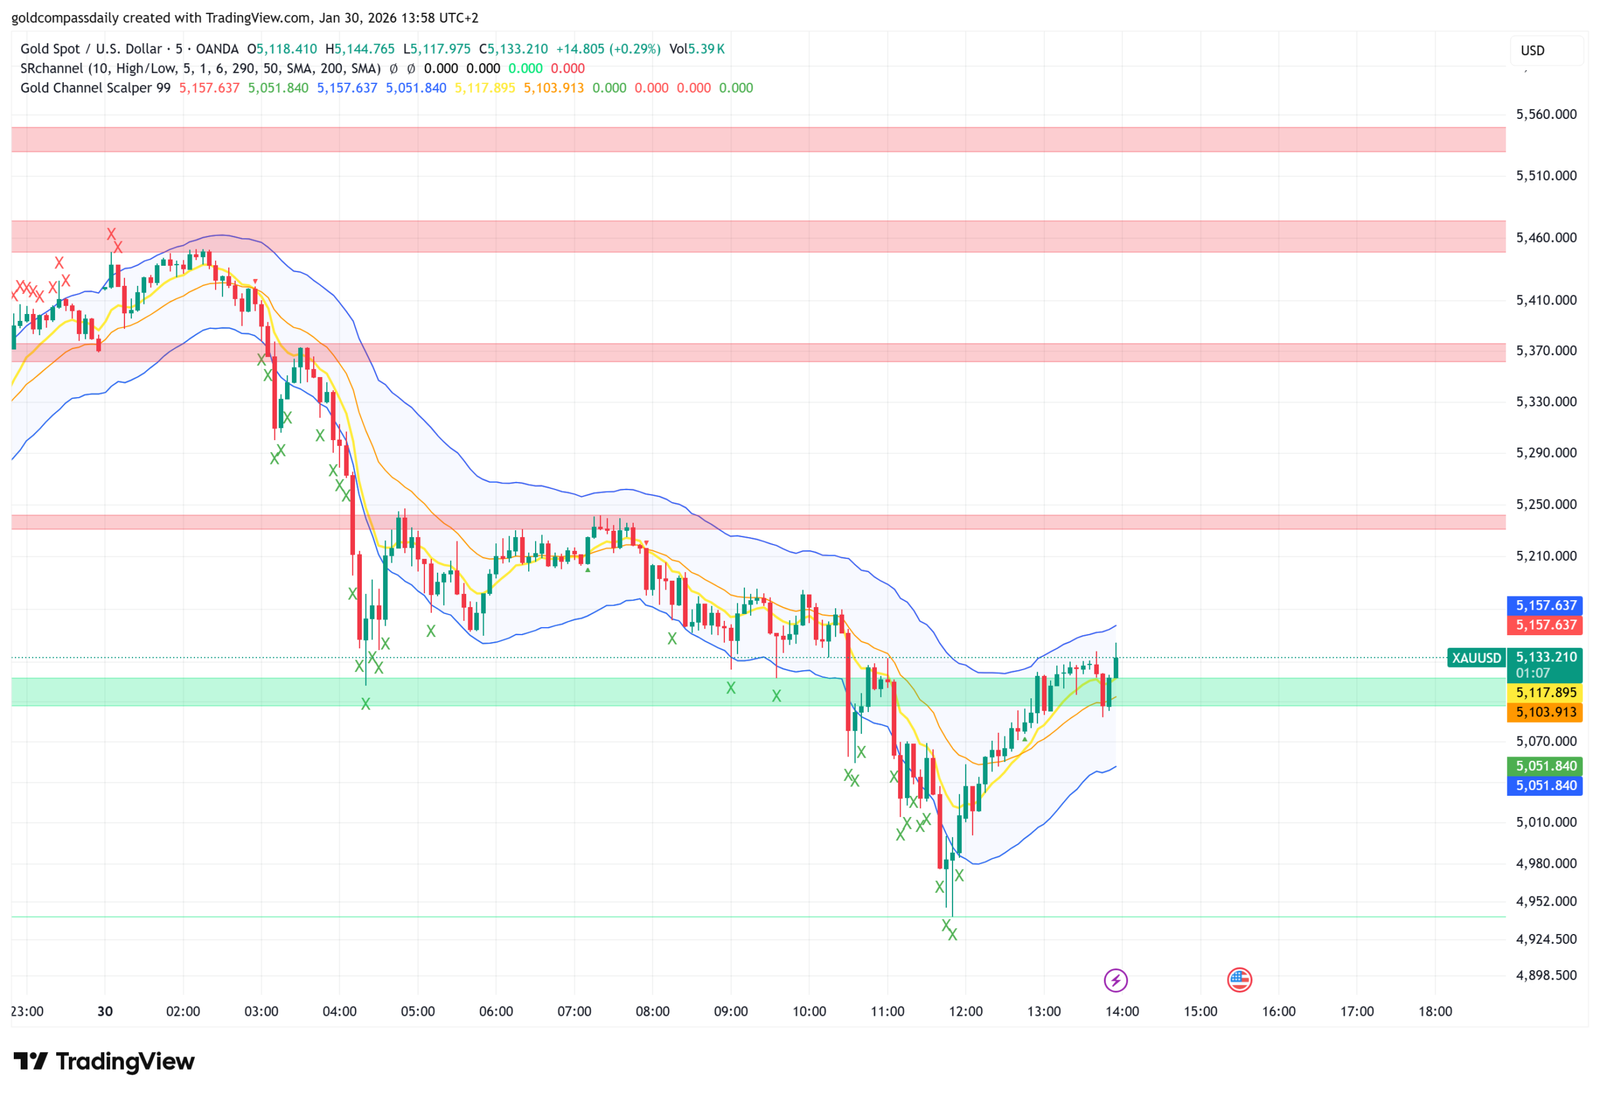
Micro-Execution: Precision on the 5-Minute Chart
The final pillar of a robust Gold Analysis 2026 is the 5-minute (5M) execution. This is where the “rubber meets the road.” While the 4H and 1H charts give us the direction, the 5M chart gives us the entry price. By using volatility channels and volume exhaustion signals, traders can pinpoint the exact moment momentum shifts at a micro-level.
Scalping in a volatile market requires a different set of psychological and technical tools. We have outlined a specific high-velocity approach in our Gold Scalping Strategy: 5M Trading Guide. This method allows you to extract profits from the market even when the higher timeframes are in a sideways consolidation phase.
Synthesizing the Timeframes: A Unified Strategy
The secret to consistent profitability in our Gold Analysis 2026 is multi-timeframe confluence. A “Triple-Green” setup occurs when:
- The 4H chart is bouncing off major structural support.
- The 1H chart confirms a change in character (CHoCH) by breaking a local high.
- The 5M chart provides a low-risk entry on a pullback to a Fair Value Gap or a channel boundary.
Conclusion: Staying Disciplined in 2026
In conclusion, the Gold Analysis 2026 highlights a market that is rich with opportunity but demands extreme discipline. Whether you are a long-term investor or a high-frequency scalper, the key is to never lose sight of the levels. Use the 4H for direction, the 1H for structure, and the 5M for timing. As the global economic landscape continues to shift, gold will remain a primary vehicle for both wealth preservation and speculative growth. Stay focused, manage your risk, and let the charts guide your compass.