
The financial markets opened the week under significant pressure, with a broad-based decline across all major US indices. As investors digest new economic data and geopolitical shifts, our market sell-off analysis reveals a growing cautiousness on Wall Street. The surge in the VIX index suggests that the “quiet days” are over, and volatility is back in the driver’s seat.
Indices Performance Breakdown
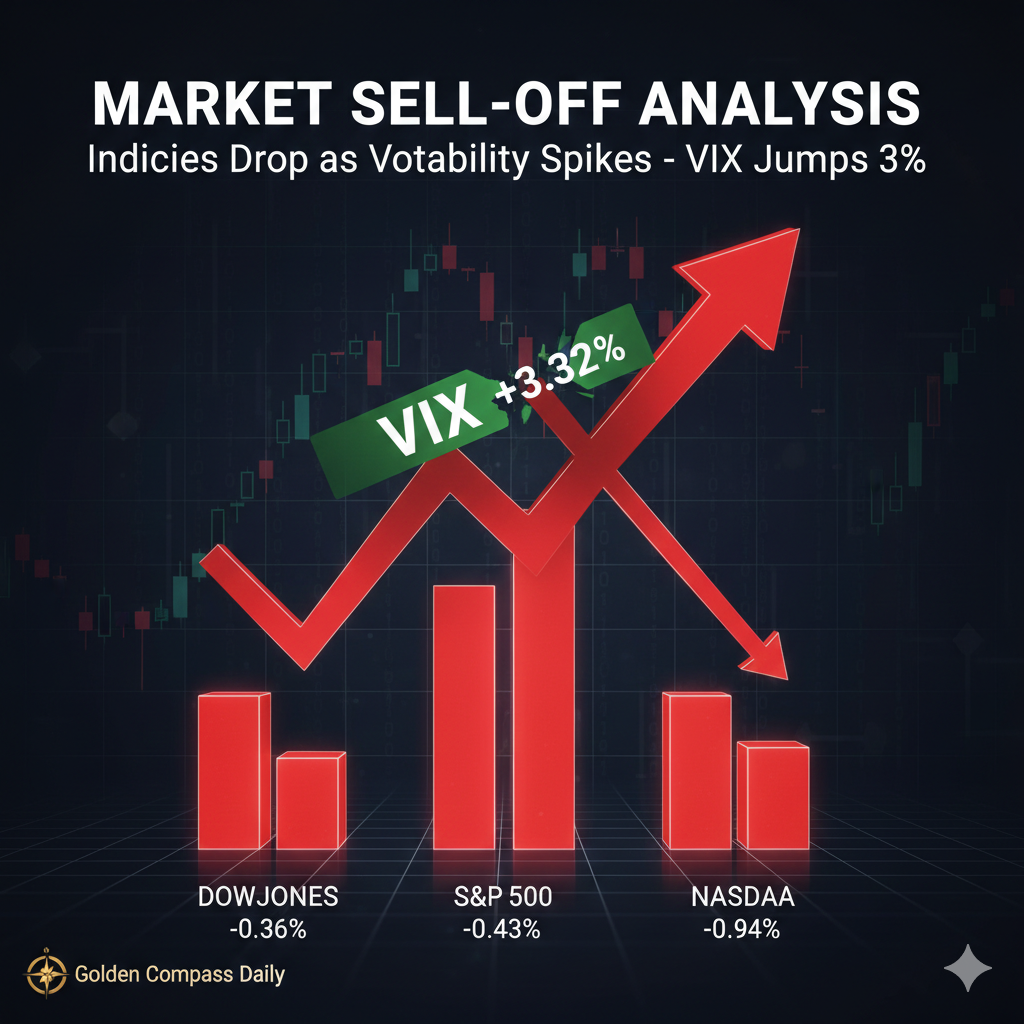
The visual data from the opening sessions confirms a bearish sentiment. The Dow Jones Industrial Average slipped by 0.36%, shedding over 170 points. While the Dow’s decline was relatively contained compared to its peers, the structural weakness is evident.
The S&P 500, often considered the best gauge of large-cap US equities, dropped by 0.43%, struggling to maintain its footing above key psychological supports. However, the heaviest blow was dealt to the tech-heavy Nasdaq, which plummeted nearly 1% (-0.94%). This disproportionate hit to technology stocks indicates a rotation out of growth assets as yields and risk perceptions shift.
The Fear Gauge: VIX Surges
Perhaps the most telling part of this market sell-off analysis is the performance of the VIX. Often referred to as the “Fear Gauge,” the VIX jumped by 3.32% to 17.44. A rising VIX during a price drop confirms that this isn’t just a minor retracement, but a move backed by increasing hedging activity and genuine market anxiety.
When the VIX rises sharply, it typically leads to broader spreads and lower liquidity, making the 5-minute and 1-hour “Blueprints” even more critical for day traders looking for precise entries.
Small Caps Leading the Decline
The Russell 2000 was the biggest loser in the session, diving 1.55%. Small-cap stocks are notoriously sensitive to interest rate expectations and domestic economic health. The fact that the Russell is leading the way down suggests that the “smart money” is concerned about the underlying strength of the economy, despite previous rallies.
What This Means for Gold (XAU/USD)
In every market sell-off analysis, we must look for where the capital is flowing. Historically, when indices like the Nasdaq and S&P 500 bleed, Gold becomes the primary benefactor. We are seeing early signs of safe-haven bidding. If the indices fail to reclaim their 20-day moving averages by the mid-week session, we expect a massive influx of liquidity into XAU/USD.
Key Levels to Watch
- S&P 500: Immediate support at 6,900. A break below could accelerate the slide toward 6,820.
- Nasdaq: Resistance now sits at 23,600. Until we see a daily close above this, the trend remains bearish.
- VIX: If the index crosses 20.00, expect “panic mode” to kick in for retail investors.
Conclusion
Current market conditions require a disciplined approach. This market sell-off analysis highlights a clear risk-off environment. Traders should focus on defensive positions and keep a close eye on the VIX. For those following our Golden Compass Daily Blueprints, pay close attention to the 1-hour structures, as volatility will likely create sharp “liquidity grabs” before any real reversal occurs.
Stay tuned for our London and New York session updates as we track these moves in real-time.