
The second-largest cryptocurrency by market cap is currently under extreme selling pressure. This Ethereum technical analysis dives into the 4-hour (4H) chart, where ETH/USD has entered a steep descending channel, breaking through multiple support structures that were expected to hold. As sentiment shifts toward fear, understanding the next “liquidity pockets” is vital for survival in this market.
ETH/USD 4H Structure: The Bearish Dominance
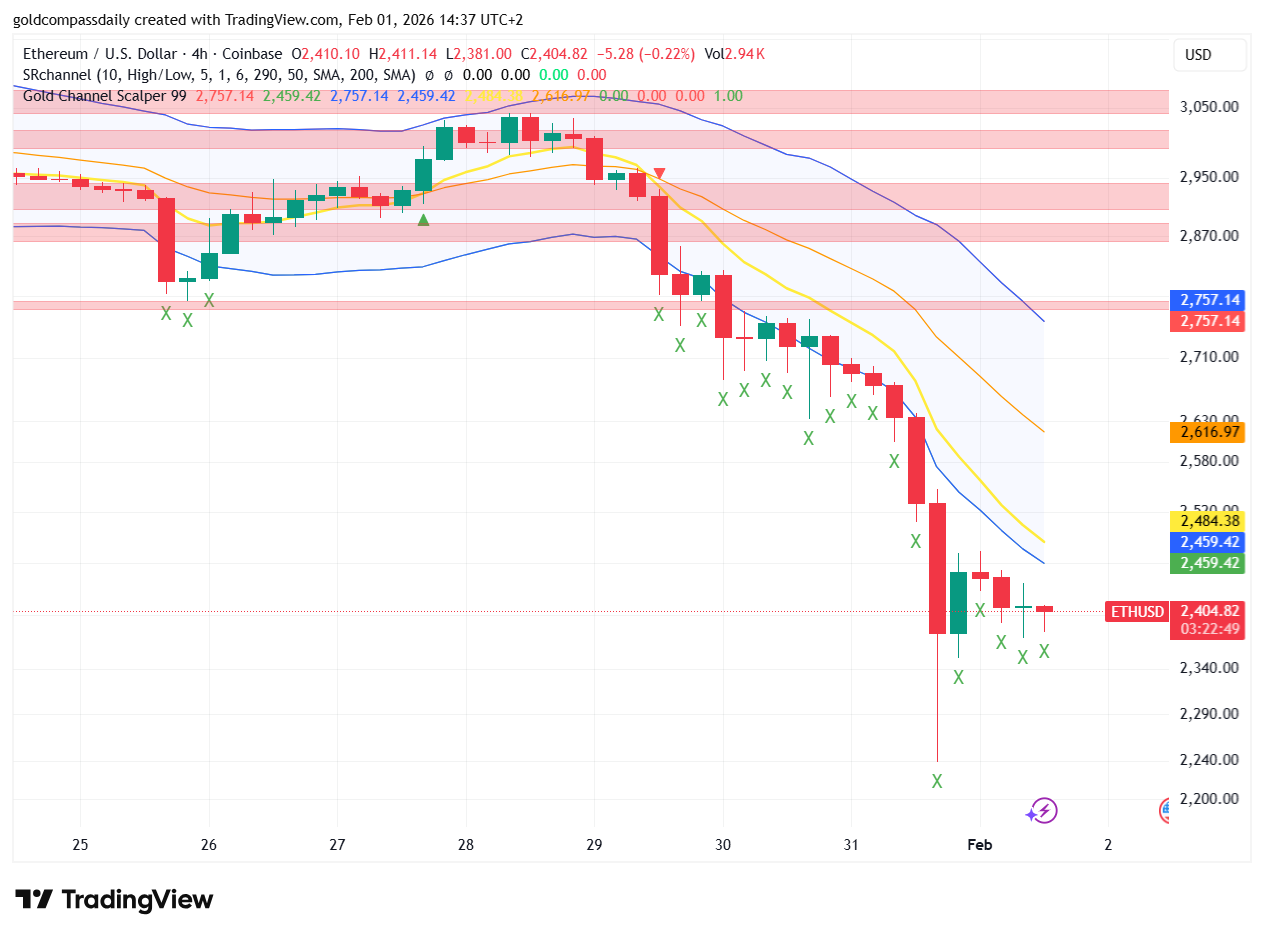
Looking at the provided 4H chart, the Ethereum technical analysis shows a clear and aggressive sell-off that accelerated over the last 48 hours. After failing to maintain its position near the $2,800 resistance zone, Ethereum plunged, losing over 15% of its value in a single trending move. The price is currently oscillating around $2,404.82, showing very little sign of immediate bullish exhaustion.
The sequence of red candles indicates a lack of significant “buy-side” liquidity. On our 4H timeframe, every minor bounce was immediately met with a fresh wave of sell orders, confirming that institutional players are likely offloading positions or hedging aggressively against broader market uncertainty.
Moving Averages and Channel Breakdown
A critical part of this Ethereum technical analysis is the failure of the moving averages. ETH has crashed through the 50, 100, and 200 SMA on the 4-hour chart. When a major asset falls below its 200 SMA on a high timeframe like the 4H, the trend officially shifts from “correction” to “bearish market structure.”
Our Gold Channel Scalper 99 indicator currently shows the price pinned at the bottom of the volatility bands. Traditionally, being this extended to the downside might suggest an “oversold” condition, but in a momentum-driven crash, the price can stay at these levels much longer than most traders’ accounts can handle. The midline of the channel (yellow line) is now acting as a distant resistance at $2,484.38.
Critical Support Zones: Where will ETH stop?
Based on our Ethereum technical analysis and historical volume profiles, we have identified the following zones to watch:
- Immediate Support ($2,381.00): This is the local low visible on the 4H chart. If this level fails to produce a “double bottom” or a strong rejection wick, the next stop is a psychological round number.
- Major Liquidity Zone ($2,200 – $2,240): There is a significant amount of “resting orders” in this area. We expect a violent reaction if the price reaches this depth.
- Immediate Resistance ($2,459.42): The previous breakdown point. For the bulls to even begin a conversation about a recovery, they must reclaim this level on a 4H closing basis.
The Correlation Factor: Why is ETH Bleeding?
While Bitcoin (BTC) is seeing a minor dip of 0.33%, Ethereum’s 2.32% intraday drop highlights a deeper weakness in the altcoin sector. This Ethereum technical analysis suggests that investors are fleeing to the relative safety of Bitcoin or stablecoins. Furthermore, the rising VIX in traditional markets (up 3.32%) is causing a “risk-off” environment where speculative assets like ETH are the first to be liquidated.
If the S&P 500 continues its descent as analyzed in our previous briefing, the pressure on Ethereum will likely persist, as the correlation between tech stocks and ETH remains historically high.
Conclusion and Trading Strategy
To summarize this Ethereum technical analysis: the trend is firmly bearish. Buying the dip here is akin to “catching a falling knife” until we see a shift in market structure on the 1-hour or 4-hour charts. The path of least resistance is currently down.
For those following our Golden Compass Daily Blueprints, the focus should be on short-selling rallies toward the $2,460 resistance or waiting for a confirmed “liquidity grab” at the $2,200 level. Do not be fooled by small green candles on the 5-minute chart; until the 4H structure changes, the bears remain in total control.
Stay disciplined, manage your leverage, and keep a close eye on our real-time ETH/USD updates during the New York session.