
The cryptocurrency market leader is facing a decisive moment as we transition into a new trading week. Our Bitcoin price action analysis on the 4-hour (4H) timeframe reveals a significant shift in market structure, transitioning from a bullish consolidation to a high-volatility corrective phase. With BTC/USD currently hovering around $78,405, the next few candles will likely determine the trend for the first half of February.
Technical Breakdown: The 4H Structural Shift
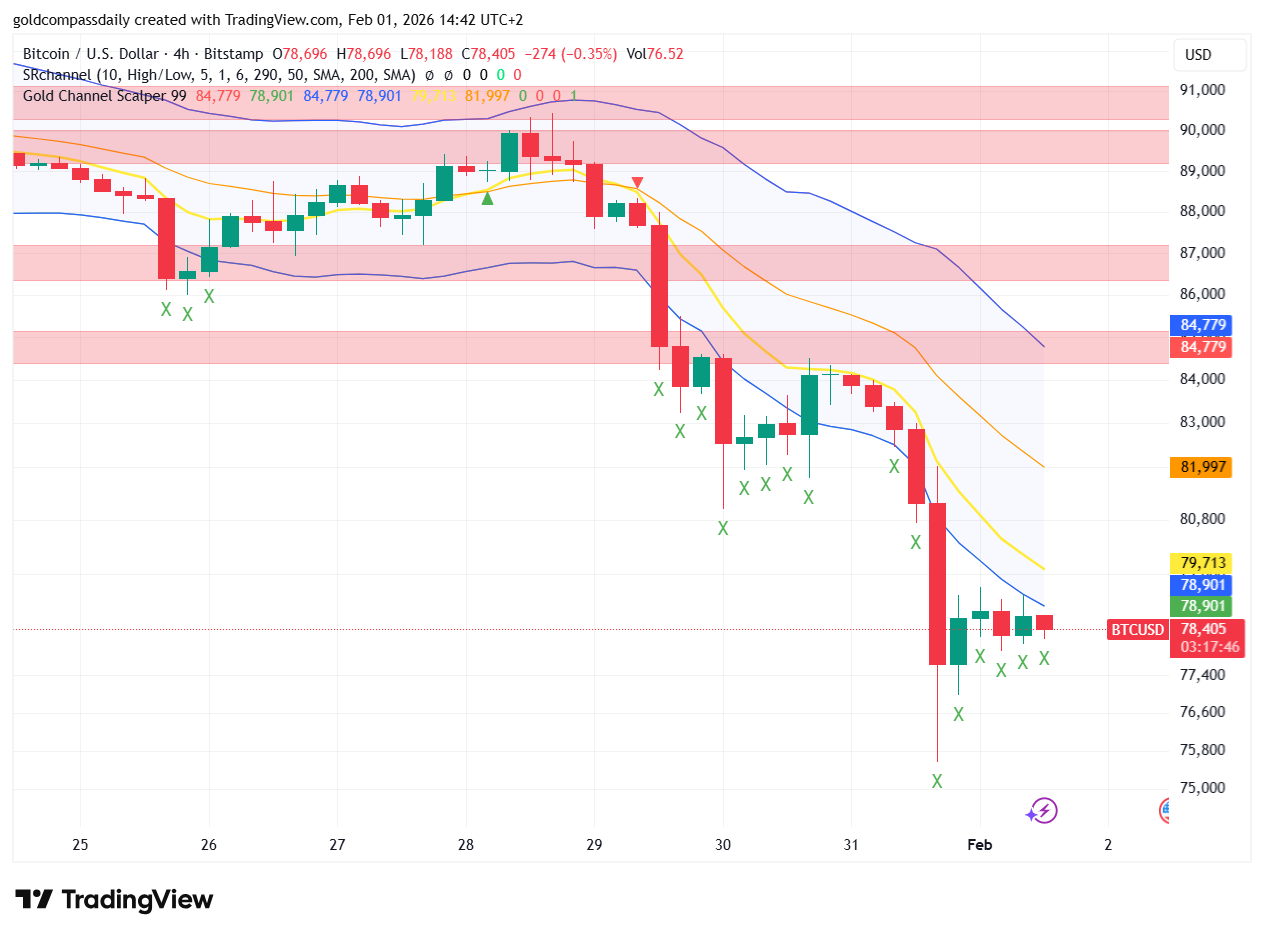
Looking at the 4H chart, the Bitcoin price action analysis shows a sharp rejection from the $90,000 psychological resistance zone earlier in the week. This rejection led to a cascading sell-off that breached the 200-period moving average—a move that has turned the short-term sentiment firmly bearish. The aggressive red candles near the end of the session indicate that sell-side liquidity is currently dominating the order book.
The price is currently resting near a local support level, but the lack of a strong “buying wick” suggests that the bulls are still hesitant to step in. This stagnation often precedes another leg down, as trapped long positions begin to hit their stop-losses, creating a “long squeeze” effect.
Volatility Indicators and The Gold Channel
Our proprietary Gold Channel Scalper 99 indicator provides a clear visual of the current overextension. BTC is trading at the very bottom of the volatility bands, which historically suggests an oversold condition. However, in our Bitcoin price action analysis, we must note that the channel itself is sloping downwards. This means that “oversold” can become “more oversold” very quickly if the macro environment continues to deteriorate.
The midline of the channel, currently sitting near $81,997, has flipped from support to a formidable resistance. Until we see a 4H candle close back inside the yellow midline zone, any upward movement should be viewed as a “dead cat bounce” or a corrective rally within a larger downtrend.
Key Price Levels to Watch
For strategic positioning, our Bitcoin price action analysis identifies the following technical landmarks:
- Critical Support ($76,600 – $77,000): This is the last line of defense before a potential slide toward the $72k zone. A breakdown here would likely trigger a broader altcoin sell-off.
- Immediate Resistance ($79,713): The first hurdle for a recovery. Reclaiming this level would stabilize the 4H structure.
- The Pivot Point ($84,779): This is the major supply zone. Only a break above this level would invalidate the current bearish thesis and put $90k back on the table.
Market Sentiment and The VIX Influence
External factors are playing a heavy role in the current Bitcoin price action analysis. With the VIX jumping over 3% and traditional indices like the Nasdaq bleeding, Bitcoin is behaving more like a high-beta risk asset than digital gold. The correlation between the SPX sell-off and the BTC dip is nearly 1:1 at the moment.
If the US markets open with further gaps to the downside on Monday, expect Bitcoin to lead the volatility. Institutional traders often liquidate crypto positions to cover margin calls in their equity portfolios, which explains the sharp “X” signals on our chart indicating sell-side pressure.
Conclusion: The Trading Blueprint
In conclusion, our Bitcoin price action analysis suggests a “Wait and See” approach for swing traders. The 4H chart is currently in a bearish momentum phase, and the path of least resistance is down toward the $76k liquidity pool.
For those following our Golden Compass Daily Blueprints, the strategy remains defensive. Look for short opportunities on 15-minute retests of the $80,000 level, or wait for a confirmed “Spring” maneuver (liquidity grab) below the current lows before looking for long entries. Capital preservation is the priority when the 4H trend is this aggressive.
Stay tuned for our London Open update where we will analyze the 5-minute order flow for potential scalp entries.