
The Big Picture: Analyzing the Current Gold Price Trend
Gold has reached a critical psychological junction. After weeks of bullish momentum, the Gold Price Trend has taken a sharp, unexpected turn. For the general public, a sudden drop in gold prices can be alarming, often signaling shifts in global economic stability or currency strength. However, for the strategic investor, these moments of “chaos” provide the clearest roadmap for future gains.
To understand where we are going, we must look at the market from a “Top-Down” perspective—starting from the long-term bird’s-eye view down to the rapid-fire movements of the last few minutes. This analysis connects the dots between market panic and institutional opportunity.
Top-Down Analysis: From Macro to Micro
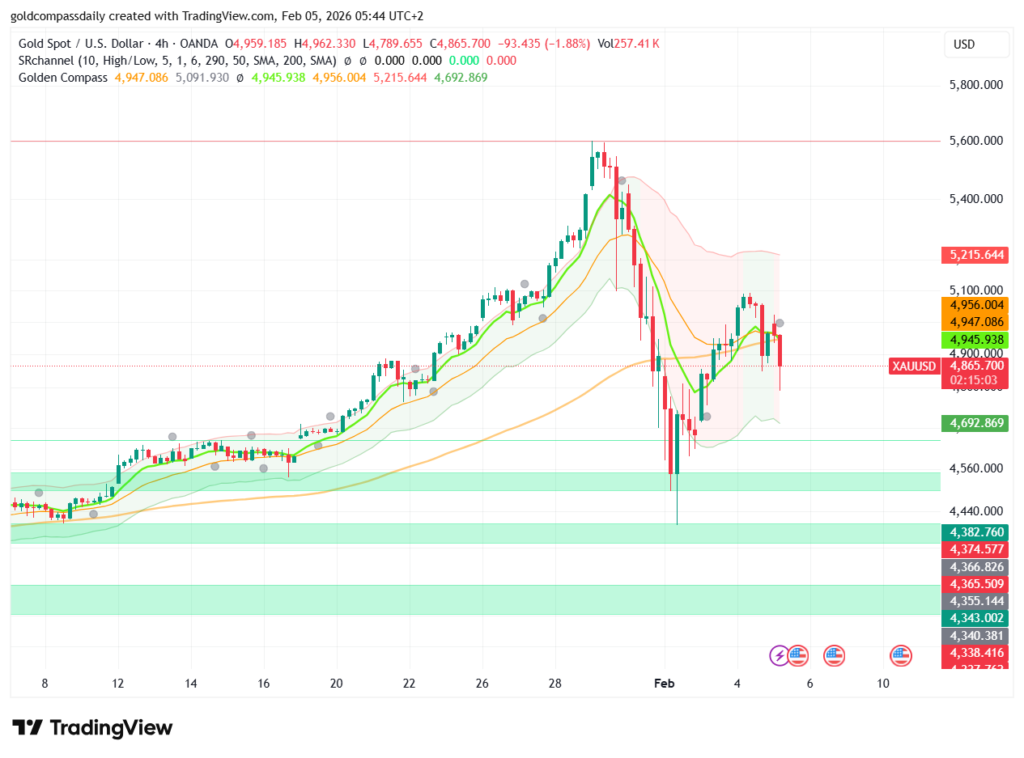
1. The 4-Hour View: The Structural Shift
On the 4-hour chart, the long-term Gold Price Trend shows a definitive rejection at the $5,215 resistance zone. After a parabolic move upward, the market has entered a corrective phase. We are currently seeing the price test the “Golden Compass” support levels near $4,865. This is a “make or break” zone; a failure to hold here could invite further downside toward $4,692.
Read the full 4-Hour Outlook here.
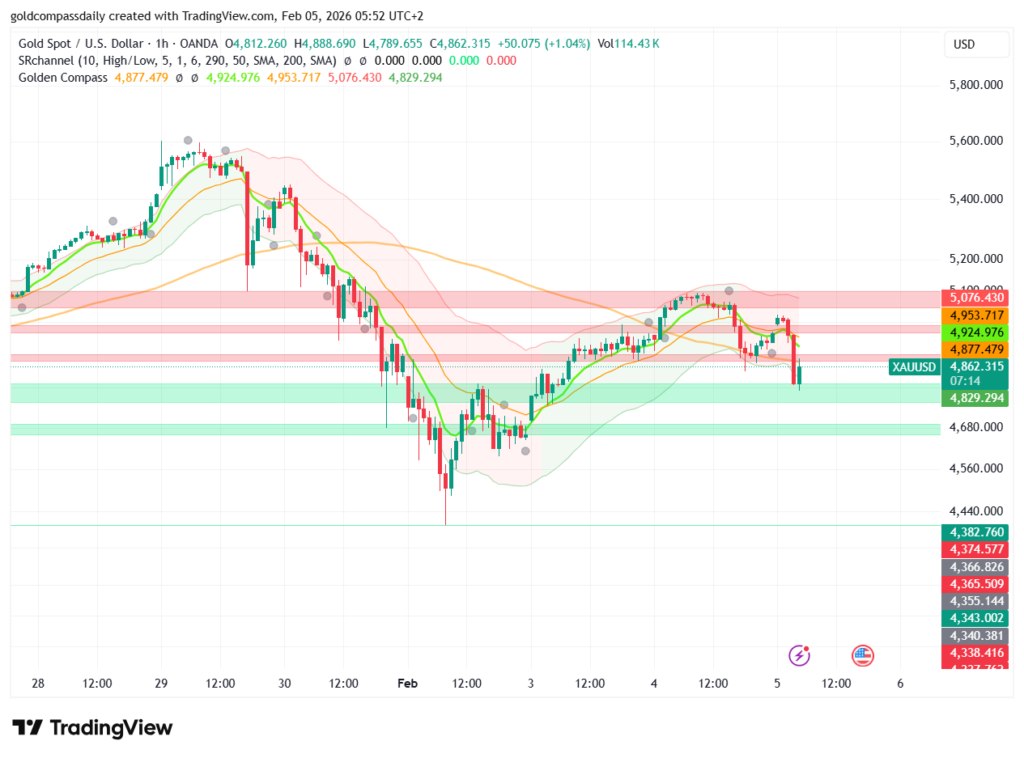
2. The 1-Hour View: The Battle for Momentum
Zooming into the hourly timeframe, the “V-shaped” recovery attempt we saw earlier in the week has been neutralized. The price is currently struggling below the 50 and 200 SMAs (Simple Moving Averages). This indicates that the short-term sentiment has shifted from “buy the dip” to “sell the rally.” The key level to watch here is $4,829—the current line in the sand for bulls.
Deep dive into the 1-Hour Analysis.
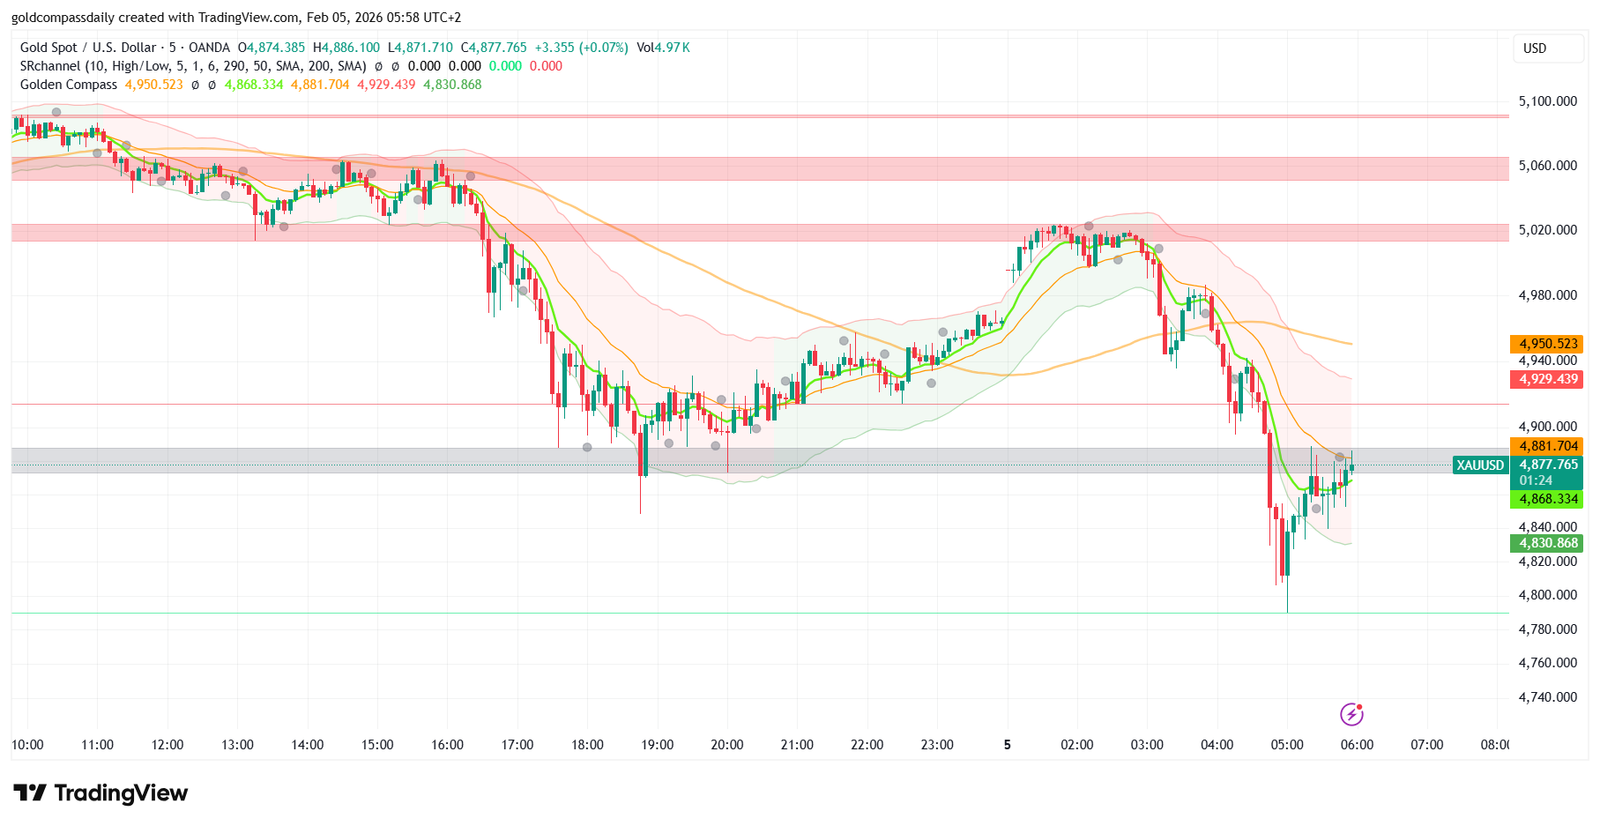
3. The 5-Minute View: Real-Time Panic and Liquidity
On the ultra-short timeframe, we see the “raw emotion” of the market. A massive spike in volume accompanied the recent drop to $4,830, suggesting a “liquidation event” where many traders were forced out of their positions. Currently, the price is consolidating in a tight range, forming what looks like a bear flag, but the extreme “oversold” conditions suggest a technical bounce is imminent.
Why the General Public Should Care
While traders focus on pips and candle patterns, the Gold Price Trend serves as a pulse check for the global economy. A weakening gold price often correlates with a surging US Dollar or rising interest rate expectations. If you are a saver, a jewelry buyer, or someone with a pension fund, these shifts impact your purchasing power. Understanding whether this is a “crash” or a “correction” helps you decide whether to protect your assets or expand your portfolio.
Final Verdict: Strategic Forecast
The convergence of our 4H, 1H, and 5M data points to one conclusion: Gold is searching for a bottom. The current Gold Price Trend is bearish in the immediate term, but we are approaching significant historical “Buy Zones” (the green areas on our charts).
- The Bearish Scenario: If XAU/USD closes significantly below $4,800, expect a slide toward $4,560.
- The Bullish Scenario: A recovery above the $4,950 resistance would signal that the “trap” is over, and the path to new highs is reopened.
As we head into the next trading session, volatility will remain high. Stay disciplined, watch the levels, and remember that price action always tells the truth, even when the news is noisy.