
Gold Price Prediction 2026: The $5,000 Battle for Market Supremacy
Gold investors are catching their breath after a roller-coaster start to February. After a dramatic liquidation that saw prices plummet toward the $4,400 zone, the “yellow metal” is staging a fierce comeback. But as the price hovers around the critical $5,060 mark, the big question remains: Is the worst of the crash truly over, or are we witnessing a sophisticated bull trap?


The Big Picture: 4-Hour Timeframe Analysis
Looking at the macro view, the 4-hour chart reveals a significant shift in momentum. The “Golden Compass” indicator recently flashed a BUY signal near the $4,700 level, marking the start of this impressive recovery. The price action is currently trading above the 50 and 200 SMAs on shorter intervals, suggesting that the immediate bearish pressure is fading.
However, the 4-hour resistance at $5,100 looms large. This area acted as previous support during the late January rally and has now flipped into a formidable ceiling. For a confirmed Gold Price Prediction 2026 bull run, we need a daily candle close above $5,120 to attract institutional volume.
Mid-Term Recovery: The 1-Hour Chart Outlook
On the 1-hour chart, the recovery looks even more structured. We see a series of higher highs and higher lows, a textbook definition of an emerging uptrend. The price has successfully reclaimed the $5,000 psychological handle, which is a massive win for the bulls. The green support bands between $4,980 and $5,040 are currently acting as a safety net for any short-term pullbacks.
Traders should watch the volume spikes near $5,080. If the market fails to break this level on high volume, we might see a retest of the $4,870 support zone before another attempt at the highs.
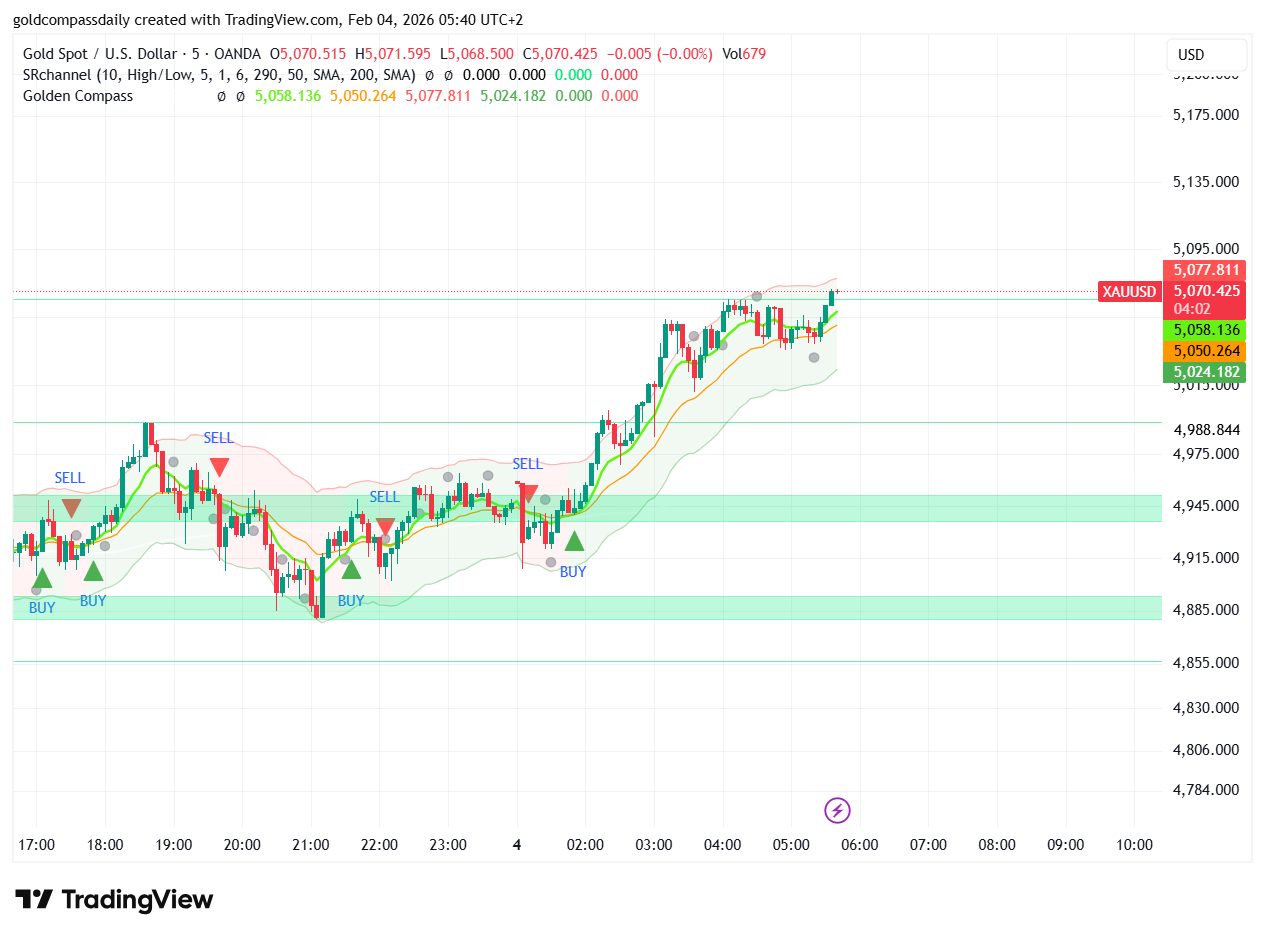
Intraday Precision: 5-Minute Scalping Levels
For those looking at immediate price action, the 5-minute chart shows high volatility near the $5,063 mark. Our “Golden Compass” tool has been navigating the choppy waters with precision, showing multiple scalp opportunities. Currently, the price is consolidated within a tight range. A break below $5,050 could lead to a quick dip to $5,040, while a surge past $5,090 opens the door for a test of the $5,150 target.
Conclusion: Is the Comeback for Real?
The technical data suggests that the market has found a temporary bottom. While the $5,000 level is a great milestone, the real test lies in the $5,100 – $5,250 zone. Investors should remain cautious and use tight stop-losses, as the 2026 market remains highly sensitive to macro-economic shifts.