
Bitcoin Price Crash: Decoding the $62,000 Market Pivot
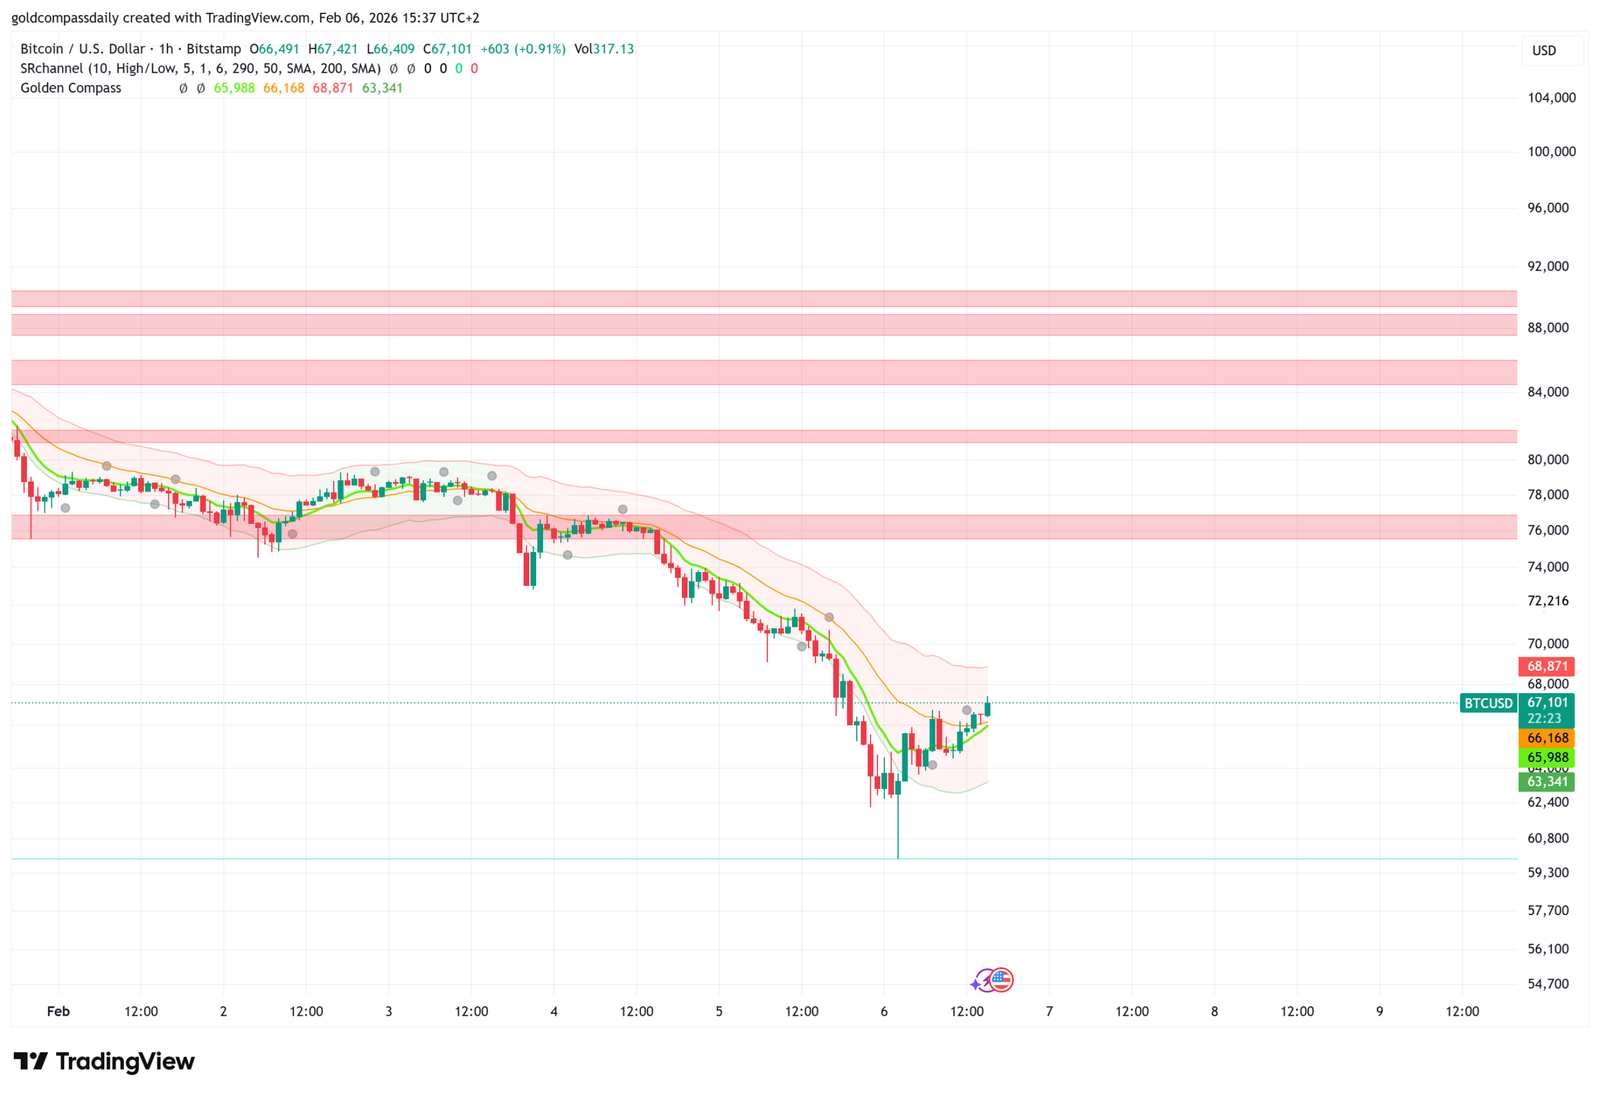
The global cryptocurrency market is currently witnessing a historic “structural reset.” On February 6, 2026, the Bitcoin Price Crash accelerated as BTC fell to approximately $62,887, marking a critical turning point in the current cycle. For the general public, this move looks like a collapse of the digital gold narrative. However, for those monitoring the 1-hour chart, it represents a calculated “liquidity flush” designed to purge over-leveraged long positions before the next major move.
While Bitcoin was trading at nearly $96,000 just weeks ago, the current price action is being driven by a “perfect storm” of rising interest rate fears under the new Fed leadership and a major rotation back into traditional defensive assets. Today’s 1-hour candles are now the most important technical indicators of the year for both retail and institutional investors.
The Anatomy of the Dump: The $62,800 Battleground
Analyzing the hourly timeframe, the Bitcoin Price Crash reached “extreme oversold” territory as it sliced through the previously impenetrable $70,000 support. The speed of the decline—dropping nearly 28% from the January highs—has forced roughly $1.4 billion in liquidations across the crypto ecosystem.
- Immediate Support ($62,000 – $62,887): This level is currently the primary “line in the sand.” If buyers cannot hold this floor on a daily close, the technical “trap door” opens toward the $58,000 psychological zone.
- Volume Analysis: We are observing a massive spike in selling volume, which often signals a “climactic” capitulation event—a necessary precursor to a sustainable bottoming process.
- Relative Strength Index (RSI): On the 1-hour scale, the RSI recently touched levels below 20. Historically, such extreme readings precede a sharp “relief rally,” though the broader trend remains under heavy bearish pressure.
Macro Triggers: Why the Safe Haven is Shaking
This Bitcoin Price Crash isn’t happening in isolation. The nomination of Kevin Warsh as the next Fed Chair has signaled a “Hard Money” era, strengthening the US dollar and making speculative assets less attractive. Simultaneously, traditional investors are withdrawing billions from spot Bitcoin ETFs to favor gold and defensive equities.
To confirm a true reversal, bulls must first reclaim the $72,000 level on high volume and convert it back into support. Until then, any upward movement is likely to be met with “exit liquidity” from institutional players looking to de-risk their portfolios.
Strategic Forecast: Rebound or Reversal?
Despite the frightening headlines, some contrarian signals suggest the market is nearing a “max pain” threshold. Sentiment has shifted from “Extreme Greed” to “Fear” in record time, which contrarian investors often view as a high-value entry point.
Critical Support & Resistance:
1. **The Floor ($62,887):** The final defense for the current 4-hour and daily bullish structure.
2. **The Recovery Target ($73,000):** A decisive break above this level is required to signal that the panic has subsided and the mid-term uptrend is resuming.
Conclusion: Navigating the 2026 Volatility
The Bitcoin Price Crash of early 2026 is a painful reminder of the market’s inherent volatility during policy shifts. While the short-term charts look daunting, the underlying adoption of digital assets continues to grow among institutional treasuries. For those with the discipline to ignore the noise, the current $62,000–$63,000 levels represent a high-stakes moment that will define the market’s trajectory for the rest of Q1 2026.