
As of February 9, 2026, the gold market is buzzing with activity. The spot price of gold (XAU/USD) has shown remarkable resilience, surging to intraday highs around $5043 before pulling back slightly. This comes amid ongoing economic uncertainties, including the recent nomination of Kevin Warsh as potential Federal Reserve Chair, which has introduced hawkish sentiments into the mix. For everyday investors wondering if now is the time to buy gold bars or ETFs, and for seasoned traders eyeing short-term opportunities, this gold price today analysis dives into the 5-minute chart action to uncover what’s driving the moves and what might happen next.
Current Market Snapshot: Gold Price Today Overview
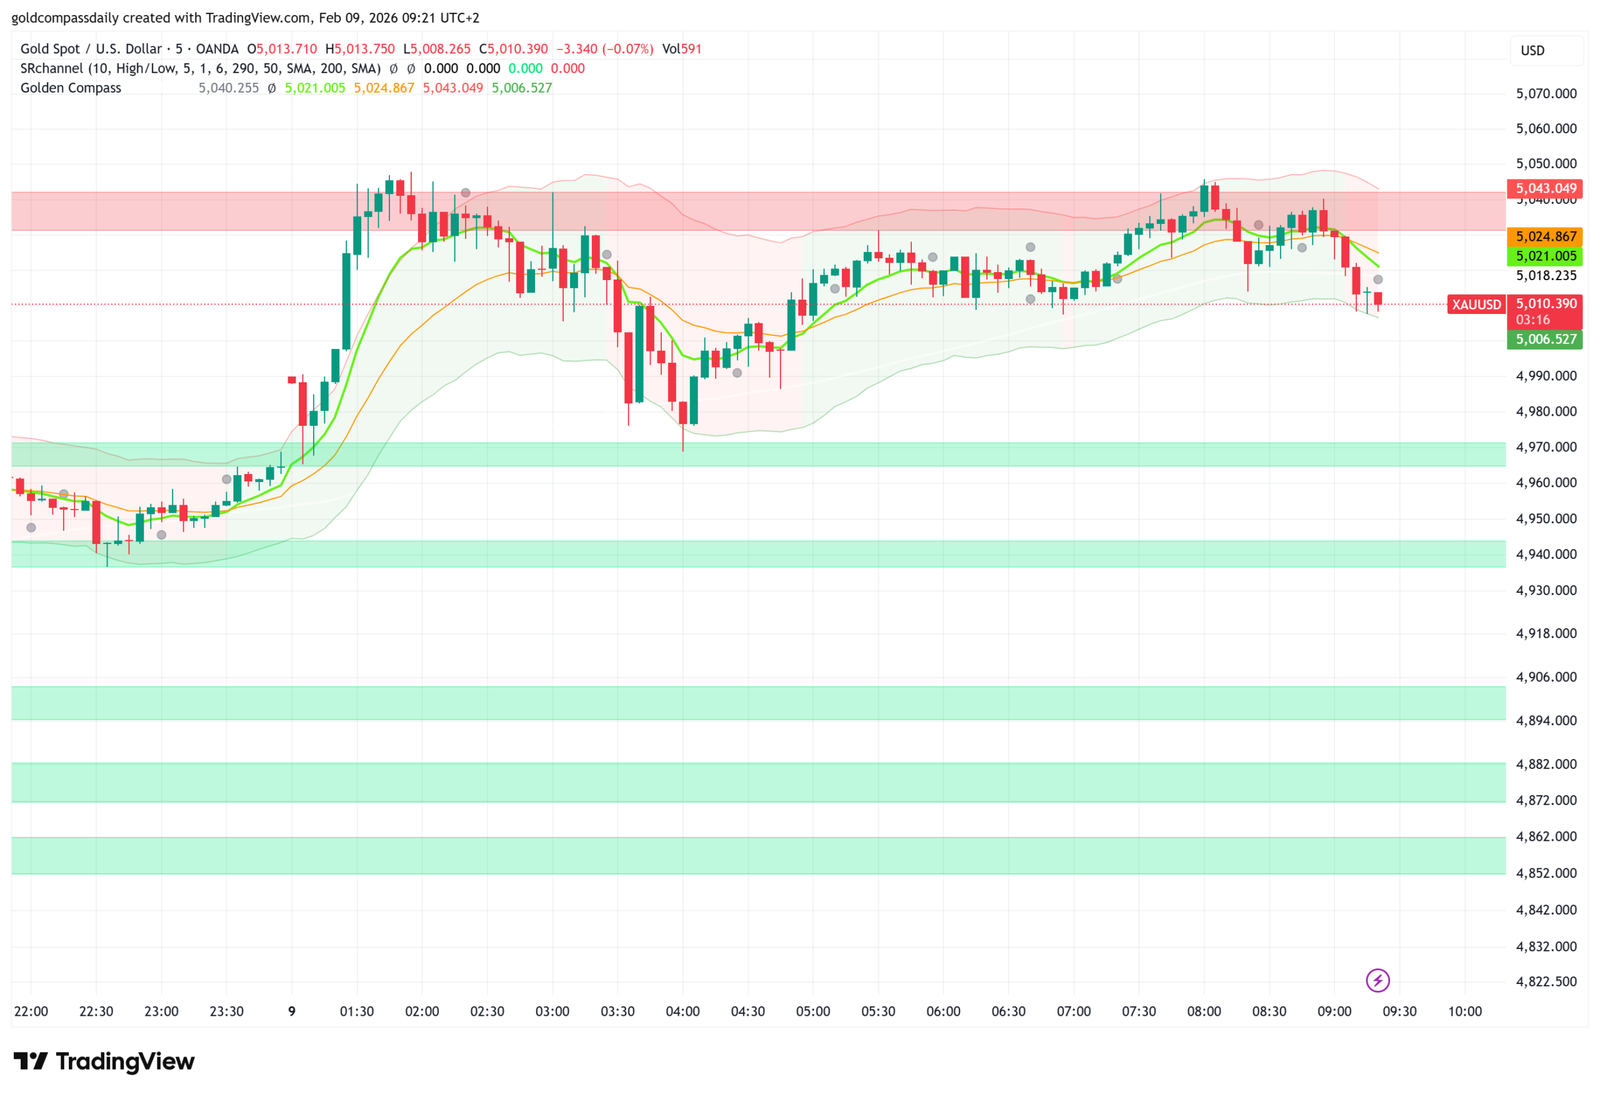
The yellow metal started the Asian session on a subdued note, trading near $4980–$4990 levels around 22:00 UTC. However, buying pressure quickly built up, pushing prices upward in a steady climb. By early European hours, gold reached a peak of approximately $5043, marking a notable 1–1.5% gain from the session lows. As of 09:21 UTC+2, the price has corrected to around $5010–$5013, down about 0.03% on the last candle, with volume at 591. This consolidation phase reflects a classic tug-of-war between bulls and bears, influenced by broader macroeconomic factors.
For non-traders, think of gold as a “safe haven” asset – people flock to it when stocks wobble or inflation fears rise. Right now, with global tensions in the Middle East and new U.S. tariff threats, central banks like China’s are continuing their buying spree, providing a floor under prices. If you’re new to this, monitoring gold price today can help you decide on diversifying your portfolio without needing to be a Wall Street pro.
Technical Breakdown: Decoding the 5-Minute Chart
Zooming into the 5-minute timeframe from TradingView, we see a clear uptrend channel supported by the SR Channel indicator. The price action began with a series of red candles (downward moves) testing the lower channel boundary around $4982–$4985. This support held firm, leading to a green candle surge that broke through the 50-period Simple Moving Average (SMA) at approximately $5021.
Key levels to watch:
- Intraday Resistance ($5035–$5043): This zone acted as a ceiling, with multiple rejections visible on the chart. A sustained break above $5043 could signal a bullish continuation toward $5100, aligning with the Golden Compass indicator’s upper band at $5043.049.
- Support Pivot ($4990–$5010): The current pullback is testing this area. If it holds, it could form a higher low, confirming bullish momentum. A drop below $4990 might trigger a quick slide to the session low of $4982.
- Moving Averages: The 200-period SMA at $5000 provides dynamic support, while shorter SMAs (10, 50) are curving upward, indicating building upside pressure.
Traders will note the negative divergence on momentum indicators like RSI (not shown but implied in the setup), where higher price highs aren’t matched by RSI peaks – a potential warning of exhaustion. However, the overall structure remains bullish, with the chart showing a “cup and handle” like formation in the early hours. For beginners, this means the market is pausing after a rise, potentially gearing up for another leg up.
Fundamental Drivers Shaping Gold Price Today
The nomination of Kevin Warsh as Fed Chair nominee has been a double-edged sword. As an inflation hawk, Warsh’s potential policies could strengthen the U.S. Dollar and Treasury yields, typically pressuring gold downward. Yet, the market has shrugged this off so far, with prices rebounding strongly from February lows around $4650–$4700. This resilience stems from structural demand: China’s central bank extended its gold-buying streak to 15 months in January, adding tons to reserves amid currency devaluation fears.
Geopolitical factors add fuel – ongoing Middle East conflicts and U.S. election aftermath have boosted safe-haven bids. Upcoming U.S. data, like the January jobs report and inflation figures later this week, could spike volatility. If jobs data surprises to the upside, expect dollar strength to cap gold’s gains; conversely, weak numbers might propel it toward $5100+.
For average readers, this translates to opportunity. Gold isn’t just for traders; it’s a hedge against uncertainty. If inflation ticks up (as some analysts predict for 2026), holding physical gold or mining stocks like GLD could protect your savings.
Trading Strategy: What to Do with Gold Price Today
For scalpers on the 5-minute chart, opportunities abound in this range-bound volatility. Look for buys near $5010 support with stops below $4990, targeting $5035–$5043. Swing traders might wait for a clear break above $5043 to enter longs, aiming for $5106 (early February highs).
Risk management is key: Use 1–2% of your capital per trade, and avoid overleveraging in this high-vol environment. Non-traders can consider dollar-cost averaging into gold ETFs if prices dip below $5000, betting on the long-term bull trend driven by fiscal concerns.
Market psychology is shifting from fear (post-January correction) to optimism. The 16–18% drop from $5608 highs flushed out speculators, allowing institutions to accumulate. This “healthy reset” sets the stage for potential new records in 2026, with banks like JPMorgan forecasting $6000+ by year-end.
Conclusion: Stability Amid Volatility
Gold price today reflects a market in recovery mode, with the 5-minute chart hinting at more upside if key resistances break. While short-term dips are possible ahead of U.S. data, the fundamental backdrop – central bank buying and geopolitical risks – remains supportive. Whether you’re a day trader scalping pips or a long-term investor, stay vigilant around $5000–$5043 levels.
Remember, gold trading carries risks, and past performance isn’t indicative of future results. This analysis is for educational purposes only and not financial advice.