
As of February 10, 2026, gold prices are showing resilience in early Asian trading, with XAU/USD holding steady around $5022.490 per ounce after a minor dip to $5011.705. This comes amid low volume (69K) and consolidation following yesterday’s rebound. Spot gold is currently trading between $5016.420 and $5022.755 according to real-time data from TradingView and Investing.com, reflecting a slight +0.00% change on the latest 5-minute candle. For everyday investors wondering if now is the time to buy gold as a hedge, and for traders looking for short-term opportunities, this gold price today analysis breaks down the 5-minute chart action, key levels, fundamental drivers, and potential next moves. With central bank buying and geopolitical risks in the background, could this consolidation set the stage for a rebound?
Current Gold Price Today Overview
Gold entered the new trading week with cautious optimism, stabilizing above the key $5000 psychological level after testing February lows near $4960–$4990 last week. By 06:05 UTC+2, XAU/USD has recovered from an intraday low of $5011.705, closing the latest 5-minute candle at $5022.490 with minimal movement (+0.125). This low-volume session (69K) suggests market participants are waiting for clearer catalysts, such as upcoming U.S. CPI data tomorrow. Over the past month, gold has gained approximately 9.3%, and year-over-year it’s up over 73%, according to Trading Economics and Kitco reports.
For non-traders, gold remains a classic “safe-haven” asset – people turn to it when stocks or currencies become uncertain. Right now, with global tensions and inflation concerns lingering, monitoring gold price today can help decide whether to add physical gold, ETFs, or mining stocks to a diversified portfolio, without needing advanced trading skills.
Technical Breakdown: The 5-Minute Chart Insights
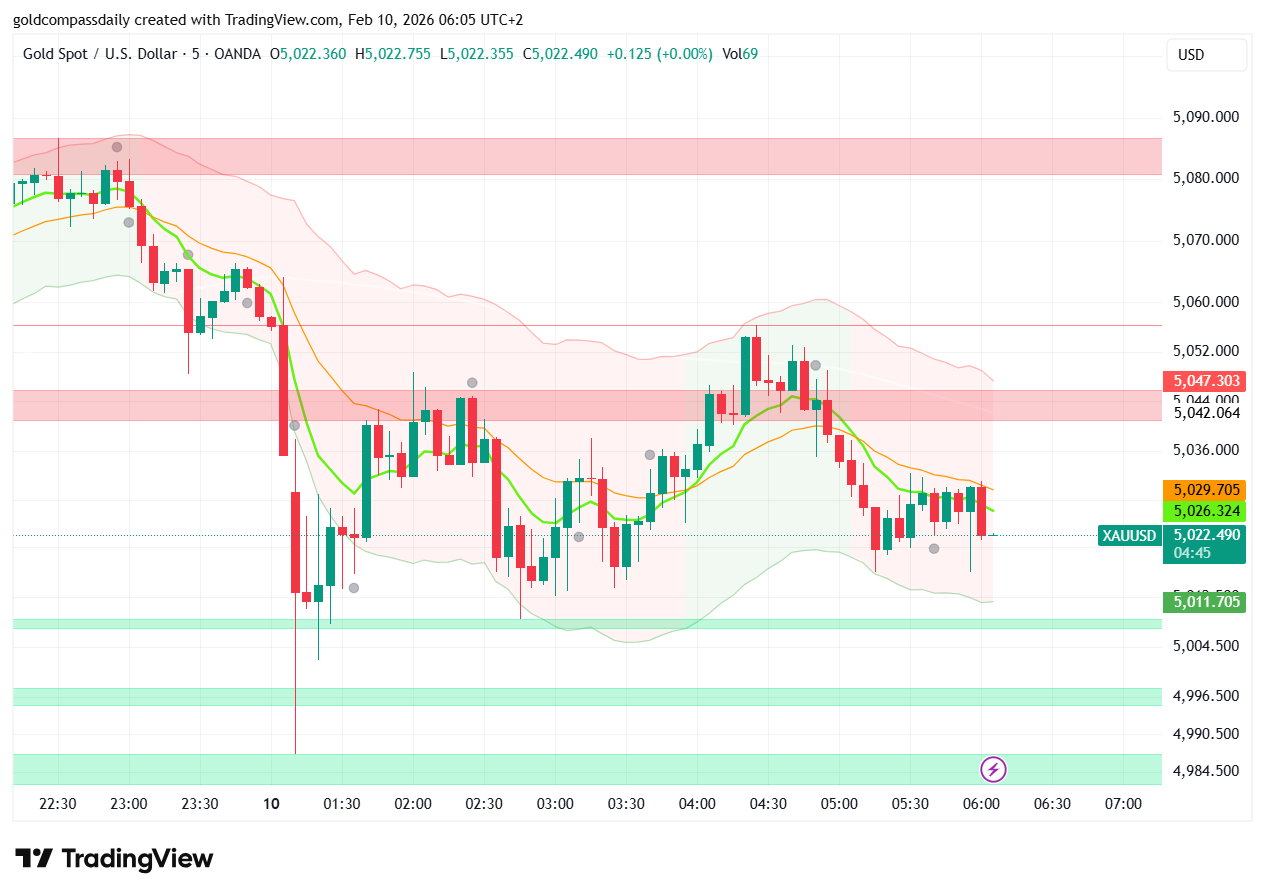
Zooming into the 5-minute TradingView chart for XAU/USD, we see a classic consolidation pattern within a broader uptrend channel. The session began with mixed candles around $5022–$5029, followed by a sharp red candle dip testing support at $5011.705 around 03:30–04:00 UTC. This level held firm, triggering a series of green candles that pushed prices back to $5022.490, forming a “hammer” reversal pattern on the lower timeframe.
Key levels to watch on the 5-minute chart:
- Resistance ($5029–$5047): This overhead zone has rejected advances multiple times today. A sustained break above $5029 could signal a quick rally toward $5070–$5101, aligning with the Golden Compass upper band.
- Support ($5011–$4995): The recent low at $5011 acts as the “line in the sand.” Holding this prevents a deeper correction to $4960, while a bounce confirms short-term bullish momentum.
- Moving Averages & Indicators: The 50-period SMA at ~$5026 provides dynamic resistance, while shorter MAs show flattening. Volume remains low (69K), suggesting limited conviction, but RSI implies neutral-to-oversold conditions, hinting at potential upside if buyers step in.
The chart’s structure resembles a “bull flag” on the micro-timeframe – a pause after gains, often preceding continuation. For beginners, this means the market is taking a breath after yesterday’s moves, potentially preparing for the next leg up once volume returns.
Fundamental Drivers Shaping Gold Price Today
Fundamentally, today’s consolidation is driven by a mix of profit-taking and anticipation of U.S. data. Kevin Warsh’s Fed Chair nomination continues to create mixed signals – hawkish rhetoric strengthens the dollar slightly, pressuring gold, but markets are pricing in softer CPI tomorrow, which could support a rebound. China’s central bank extended its gold-buying streak for the 15th month, adding structural demand amid currency devaluation risks, as reported by Reuters and the World Gold Council.
Geopolitical floors (Middle East tensions, U.S. tariff threats) and record central bank purchases (230 tonnes in Q4 2025) keep downside limited. Analysts from JPMorgan and Deutsche Bank maintain bullish forecasts of $6000+ by end-2026, citing fiscal deficits and de-dollarization. For average readers, this means gold isn’t just for speculators – it’s a practical hedge against inflation and uncertainty, ideal for long-term savings or retirement portfolios.
Trading Strategy: What to Watch Next
For scalpers on the 5-minute chart, opportunities lie in range trading: buy near $5011 support with tight stops below $4995, targeting $5029–$5047 for quick pips. Swing traders should wait for a decisive close above $5029 to enter longs, aiming for $5070, using 1% risk per trade in this low-volume environment.
Non-traders can consider dollar-cost averaging into gold ETFs or physical bars on dips below $5000, betting on the long-term bull case. Market psychology is shifting from fear (post-January correction) to cautious optimism – this minor dip flushes weak hands, allowing institutions to accumulate at better levels.
Conclusion: Consolidation Before the Next Move
This gold price today analysis highlights a market in consolidation mode, with the 5-minute chart suggesting potential rebound if support holds. While near-term volatility remains ahead of U.S. data, fundamentals like central bank buying and safe-haven demand keep the broader outlook positive through 2026. Stay patient around $5000–$5030 levels, and avoid chasing in low-volume sessions.
Gold continues to prove its value in uncertain times – whether for active trading or long-term protection, today’s price action offers valuable insights for all investors.