
Gold (XAU/USD) price action has delivered a textbook validation of our technical roadmap over the weekend. Following the aggressive liquidity sweep into the $4,880 demand zone, the metal has adhered with high precision to the projected recovery path, successfully clearing intraday obstacles to reclaim the critical $5,040 handle.
Market Precision: The “Green Path” Realized
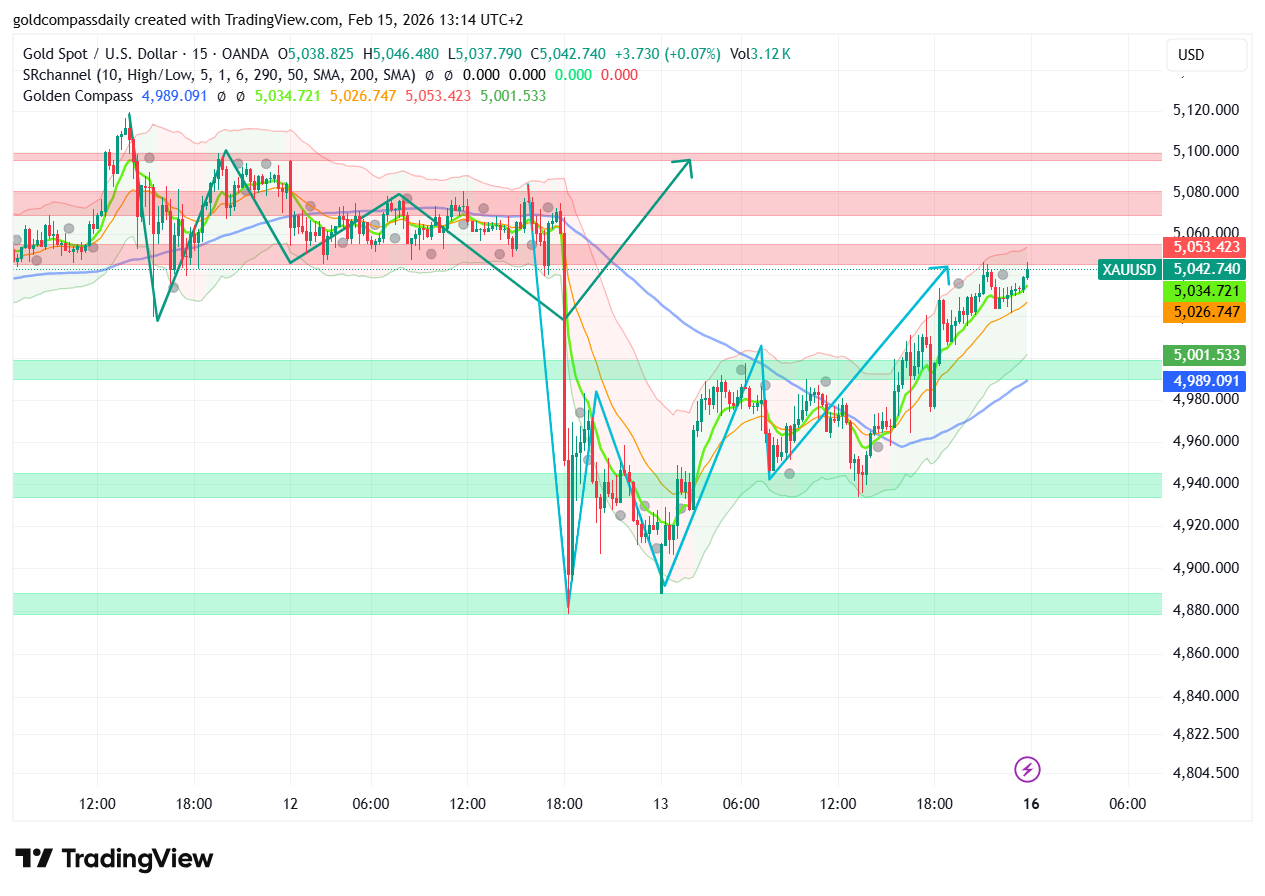
The latest 15-minute chart confirms that the structural floor established at $4,880 served as the definitive pivot for this week’s reversal. After a brief period of consolidation within the $4,940 – $5,000 range, Gold found the necessary momentum to break through the psychological $5,000 barrier, tracking the primary bullish trajectory (teal arrow) toward our secondary objectives.
Technical Indicators Align for Expansion
The current price of $5,042.74 marks a significant milestone in the recovery phase. Gold is now trading firmly above the Golden Compass EMA cluster, with the 20, 50, and 200 EMAs fanning out in a bullish alignment. This shift in momentum suggests that the previous “liquidation” phase has been fully absorbed by institutional demand.
- Structural Strength: The higher-low formation at $4,940 remained untouched during the latest push, reinforcing the strength of the current trend.
- Volume Confirmation: The steady ascent toward $5,040 has been accompanied by stable volume, indicating a lack of aggressive selling pressure at these levels.
The Next Objective: Targeting the $5,100 Ceiling
With the $5,040 pivot now acting as potential support, the focus shifts to the final leg of the expansion path. The primary target remains the heavy supply zone between $5,080 and $5,100. Traders should watch for a minor consolidation or “retest” of the $5,030 level before the market attempts a high-volume breakout toward these record highs.
| Strategic Milestone | Price Level | Current Status |
|---|---|---|
| Primary Expansion Target | $5,095 | Pending Reach |
| Immediate Pivot (Flip) | $5,040 | Successfully Reclaimed |
| Psychological Floor | $5,000 | Confirmed Support |
| Major Liquidity Origin | $4,880 | Historical Bottom |
Disclaimer: This intraday analysis is based on the precision of current chart patterns. Gold trading involves substantial risk. Ensure your risk management parameters are adjusted to account for potential volatility near the $5,100 resistance zone.