
As of the afternoon of February 18, 2026, Gold (XAU/USD) has demonstrated remarkable technical precision, perfectly validating the projected “recovery path.” After a necessary corrective phase that tested lower liquidity zones, the price action has shifted back into an impulsive bullish cycle, currently trading near $4,953.
Execution of the Forecasted Path
The market followed the anticipated trajectory with high accuracy. Following the initial peak, Gold underwent a shallow correction to gather the necessary buy-side liquidity. This “dip and rip” maneuver allowed the price to stabilize before aggressively reclaiming lost ground, proving the resilience of the underlying uptrend in the current macro environment.
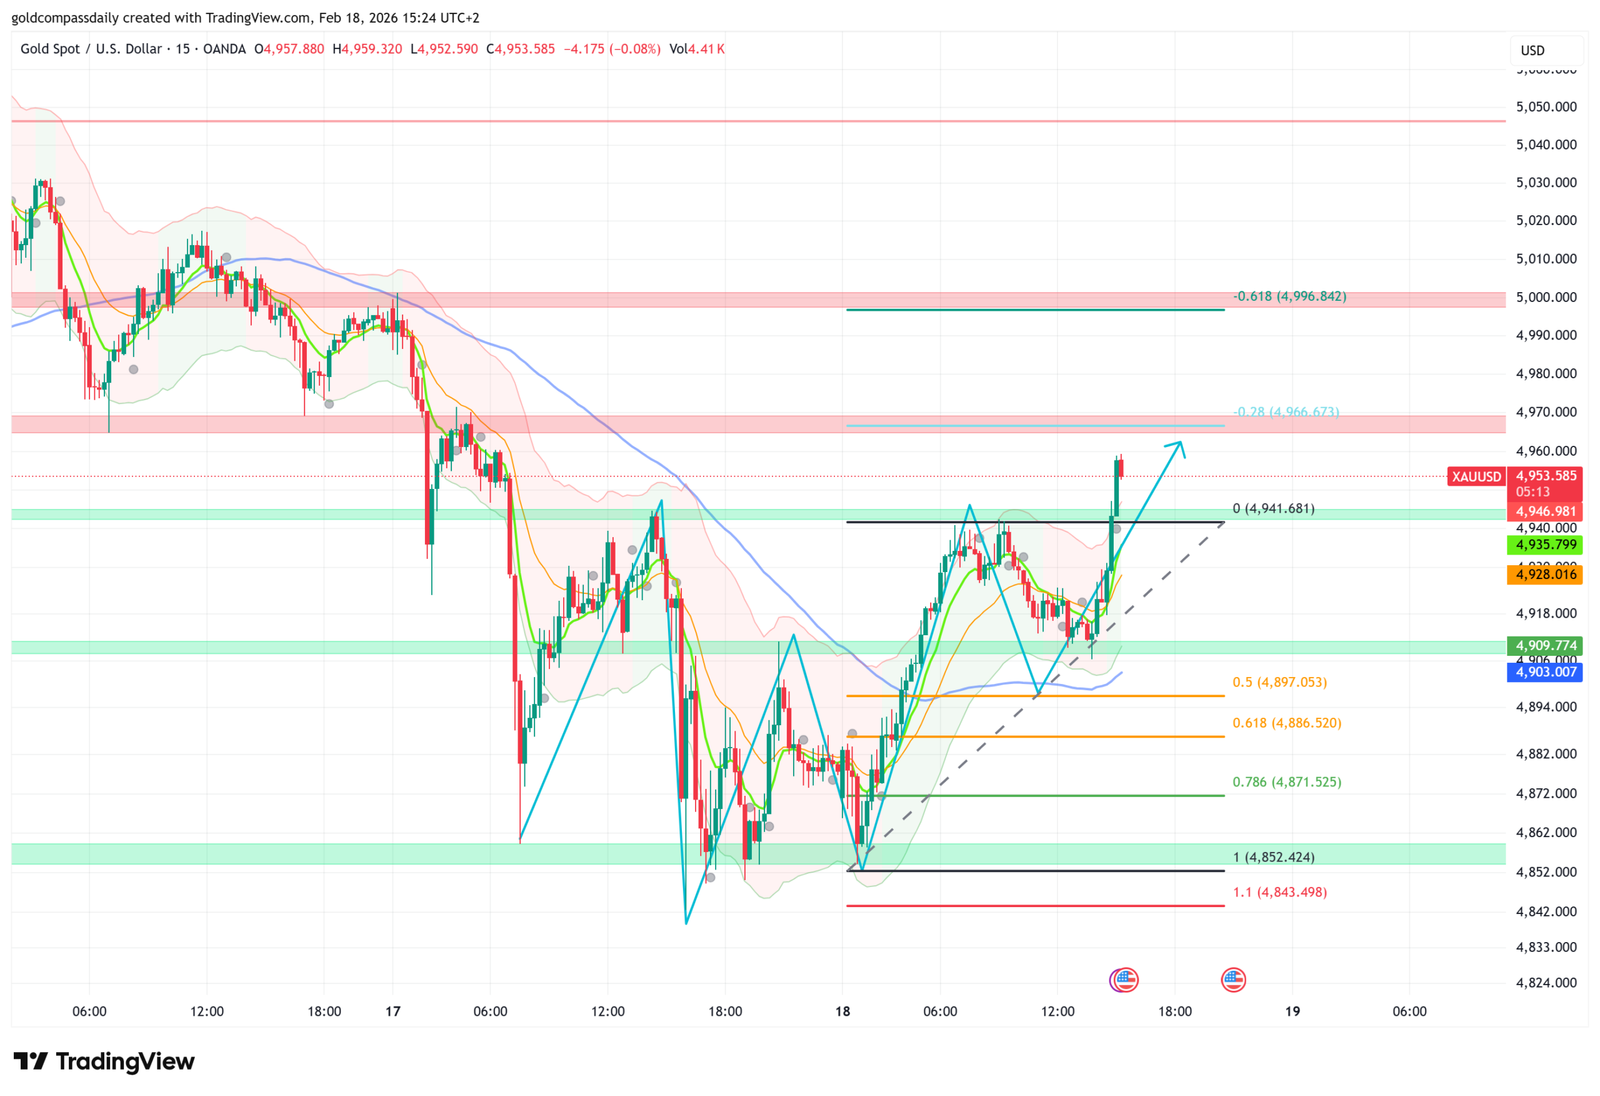
- Validation of Support: The price successfully bounced off the structural support levels near $4,852, forming a solid base for the current leg higher.
- Momentum Shift: The recent 15-minute candles show a strong bullish engulfing character, clearing previous minor resistance pivots with ease.
Fibonacci Reaction and Breakout Targets
Traders are now focused on the reaction at the upper Fibonacci retracement levels. Having breached the 0.5 level, the focus shifts to the 0.618 ($4,996) and the -0.28 ($5,076) extension targets. A clean break above the psychological $5,000 mark will likely trigger a fresh wave of FOMO (Fear Of Missing Out) among retail participants.
| Projected Objective | Price Level | Technical Significance |
|---|---|---|
| Immediate Target | $4,966 – $4,980 | Prior Resistance / Liquidity Zone |
| Major Resistance | $4,996 | 0.618 Fibonacci Retracement |
| Extension Goal | $5,076 | -0.28 Fibonacci Extension |
Market Outlook
The current price action suggests that the “correction is over” and the bulls are back in full control. While minor intraday fluctuations are expected, the macro structure remains firmly pointed toward higher highs. Investors should watch the closing prices on the 4-hour timeframe to confirm the sustainability of this breakout.
Disclaimer: This analysis is based on current technical chart patterns. Trading XAU/USD involves significant risk of loss. Always use appropriate stop-loss orders to protect your capital.