
As of February 19, 2026, Gold (XAU/USD) is exhibiting clear technical signals that support a bearish corrective phase. Following a period of consolidation around the $5,000 psychological handle, the precious metal has encountered persistent rejection at key moving average levels, validating the short-term downward trajectory projected in recent sessions.
The Bearish Case: Rejection at the 21 SMA
Gold is currently trading near $4,998, effectively pinned below the 21 Simple Moving Average (SMA) located at $5,026. This level has served as a formidable barrier, with recent intraday attempts to push higher resulting in “exhaustion” candles and negative divergence on relative strength indicators. This structural weakness suggests that the path of least resistance has shifted toward the downside for the remainder of the week.
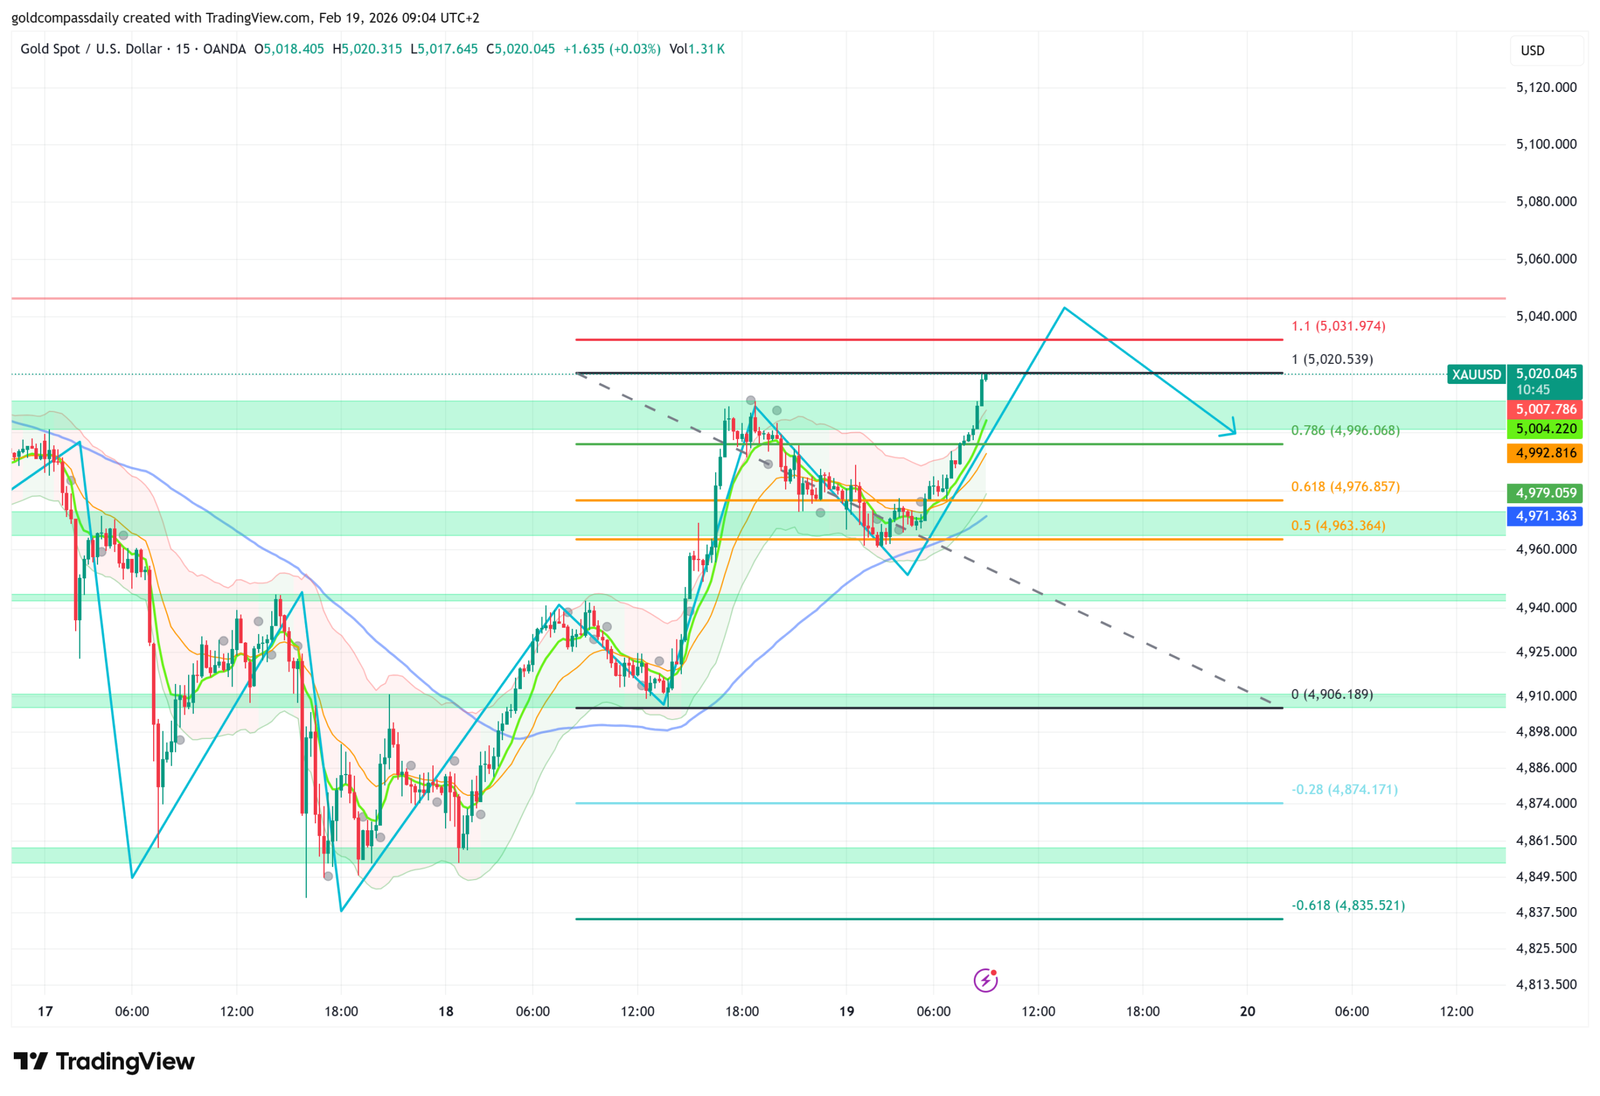
- Structural Resistance: The $5,000 – $5,050 zone continues to act as a significant “ceiling,” with sellers remaining in control within a descending channel that formed on February 9.
- Negative Divergence: Indicators such as the MACD and RSI are flashing negative signals despite minor price recoveries, indicating that bullish momentum is fading rapidly.
Correction Targets: Hunting the 200 EMA
With the breakdown from the $5,000 pivot, the primary technical objective for this correction is the 200-period EMA, currently situated near $4,827. A sustained move below the $4,937 support level could accelerate this decline, potentially targeting the $4,760 daily low as liquidity outflows increase.
- Immediate Downside: A drop below $4,960 is expected to validate the short-term bearish cycle toward the 7/8 Murray level at $4,687.
- Bullish Invalidation: Only a decisive breakout and consolidation above the $5,026 mark would cancel the current bearish thesis and signal a renewed attempt to test the $5,100 resistance.
Key Technical Levels for February 19, 2026
| Type | Price Level | Technical Significance |
|---|---|---|
| Major Resistance | $5,026 | 21 SMA & Bearish Pivot |
| Current Market Pivot | $4,996 | Psychological Threshold |
| Correction Target 1 | $4,827 | 200 EMA Support |
| Deep Support Floor | $4,760 | Projected Daily Low |
Disclaimer: This intraday analysis is based on real-time chart patterns and technical indicators as of February 19, 2026. Trading gold carries significant risk; investors should remain cautious as high-impact macro data and FOMC minutes may trigger sharp reversal patterns.