
Gold prices (XAU/USD) are currently locked in a high-stakes technical battle as the market digests a whirlwind of fundamental and technical signals. As of February 23, 2026, bullion is hovering around the critical $5,150 mark, a level that represents the 0.5 Fibonacci retracement of the recent bullish leg. While technical indicators point toward a potential “springboard” effect, the shadow of renewed trade wars looms large.
The Technical Setup: Fibonacci Bulls Defend the Line
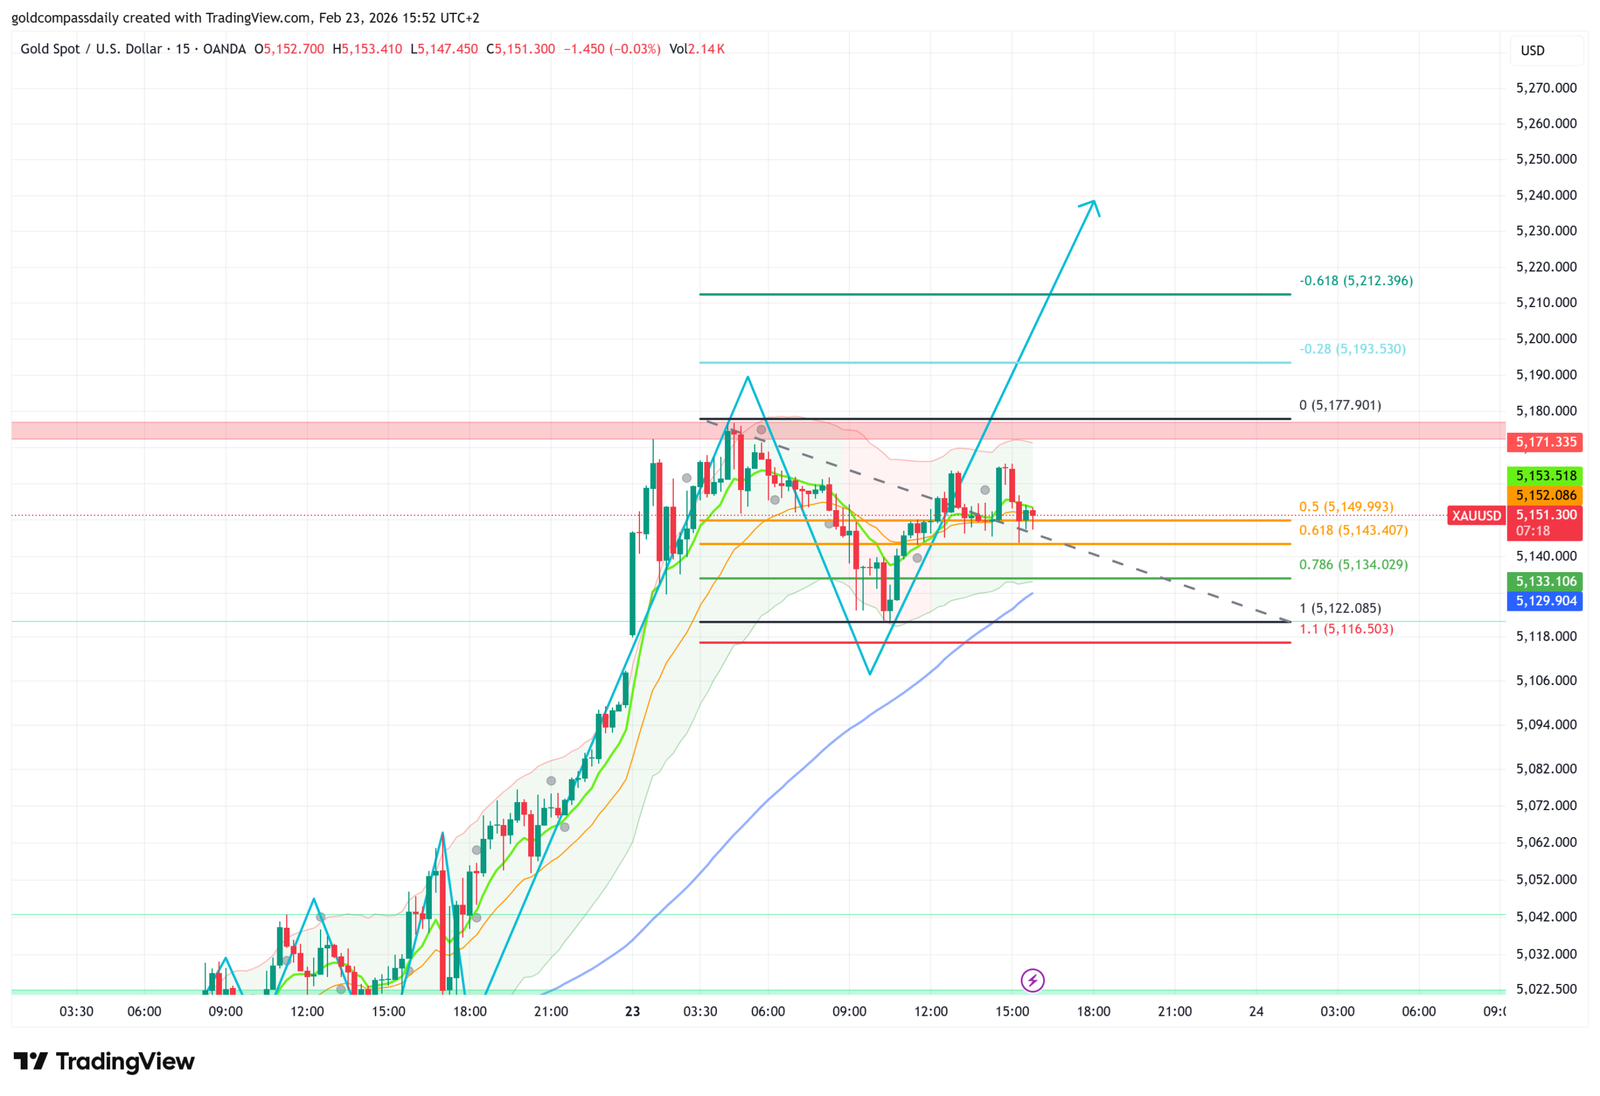
On the 15-minute and hourly charts, Gold has entered a classic consolidation phase. After a sharp rejection from recent highs, the price has found a temporary floor at $5,149.99 (the 0.5 Fib level). Historically, this “equilibrium” zone is where institutional buyers look for entries to rejoin the primary uptrend.
- Support Zone: The $5,140 – $5,150 range is reinforced by the 50-period moving average. A sustained close above this area keeps the bullish dream alive.
- Resistance Zone: To confirm a breakout, bulls must clear the $5,177 supply zone. A daily close above $5,200 would likely trigger a massive short-squeeze toward $5,300.
The current chart pattern resembles a tightening wedge. Price compression usually precedes an explosive move. According to the Fibonacci sequence, a successful defense of the 0.5 level often leads to a retest of the -0.618 extension, which currently sits near the $5,212 handle.
The Fundamental Wildcard: Trump’s 15% Tariff Shock
Technical analysis rarely exists in a vacuum, and today’s catalyst is coming straight from the White House. Following the Supreme Court’s decision to strike down previous trade measures, President Trump has moved swiftly to announce a new 15% global tariff using alternative legal statutes.
This creates a complex “double-edged sword” for Gold investors:
- The Bearish Case (Stronger Dollar): New tariffs typically lead to capital flows back into the US Dollar as investors prepare for higher domestic inflation and a hawkish Fed response. If the DXY (Dollar Index) spikes, Gold could easily break below its Fibonacci support.
- The Bullish Case (Safe-Haven Demand): Conversely, a global trade war fuels uncertainty. If markets perceive the new tariffs as a threat to global growth, Gold will regain its status as the ultimate safe haven, potentially skyrocketing despite a stronger greenback.
Market Sentiment and 2026 Outlook
Current sentiment remains cautiously optimistic. Traders are closely watching the $5,134 level as the “line in the sand.” Should this level fail to hold under the pressure of trade-policy volatility, a deeper correction toward the 0.618 Fibonacci level ($5,143) or even the psychological $5,000 floor is on the cards.
However, if the 15-minute candle closes impulsively above the current descending trendline, your “blue arrow” scenario is likely to play out. Investors are advised to maintain strict stop-loss orders given the intraday volatility triggered by the Reuters headlines.
Investor Note: Keep an eye on the New York session open. The interaction between the Fibonacci 0.5 support and the opening volatility will define the trend for the remainder of the week.
Disclaimer: Trading gold involves significant risk. This analysis is for educational purposes only and does not constitute financial advice.