
Market Update: Gold Consolidates Gains Before Potential Surge to $5,300
The gold market (XAU/USD) remains in a decisively bullish posture as it navigates the mid-week trading sessions. Following a sharp recovery from previous lows, the price action is currently exhibiting a textbook consolidation phase. This “breathing room” is essential for the market to absorb recent gains and build the necessary liquidity for a sustained breakout toward the psychological $5,300 milestone.
Navigating the Fibonacci Consolidation Zone
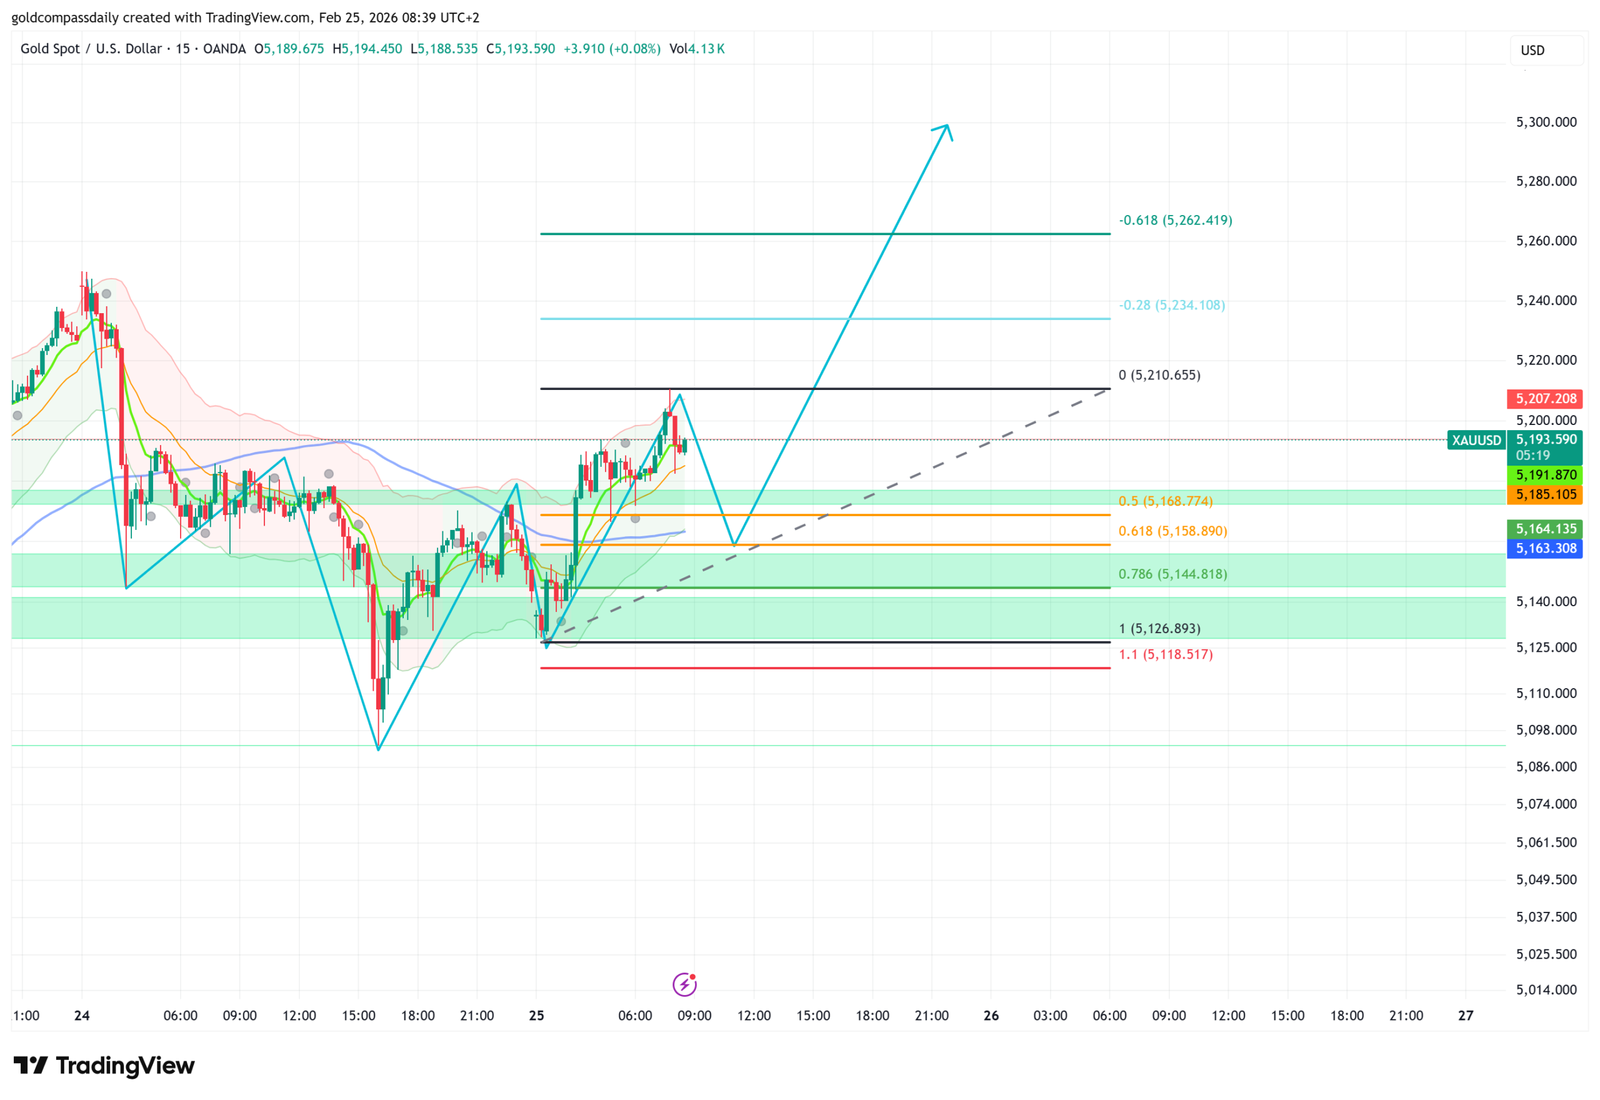
On the 15-minute timeframe, the technical structure confirms that bulls are in control, but a temporary slowdown is underway. The current price action is hovering around the $5,193.590 mark, firmly positioned within a strategic accumulation zone. Your analysis correctly identifies the importance of the internal Fibonacci retracement levels as the primary “staging area” for the next move.
- The 0.500 Pivot ($5,168.774): This level serves as the immediate midline for the current range. Stability here indicates that half of the recent impulse move has been successfully defended by buyers.
- The 0.618 “Golden” Pocket ($5,158.890): This remains the most critical support zone. A brief touch or consolidation around this level would offer a high-probability “buy the dip” opportunity, as it often marks the exhaustion point for corrective sellers.
- Structural Integrity: As long as XAU/USD maintains its position above the 0.786 level ($5,144.818), the bullish thesis remains not only valid but highly probable.
The Road to $5,300
The projected trajectory suggests that once the current consolidation phase completes—likely within the next few trading sessions—the path of least resistance leads to $5,300. The lack of significant historical resistance above the $5,210.655 pivot high creates a “liquidity gap” that price can fill rapidly. Current market sentiment, bolstered by ongoing geopolitical tensions and tariff-related volatility, continues to favor precious metals as the ultimate safe haven.
Technical Indicators and Momentum
Momentum oscillators are currently cooling off from overbought conditions, which is a healthy development for long-term bulls. The convergence of moving averages beneath the current price provides a dynamic floor, while the volume profile shows signs of accumulation rather than distribution. Traders should look for a “squeeze” pattern to form around the $5,185 – $5,195 area; a decisive break above $5,210 will likely trigger the impulsive wave toward the final target.
In conclusion, the current sideways movement is a classic “bull flag” or consolidation pattern. By respecting the Fibonacci levels at 0.500 and 0.618, the market is preparing for its most significant test of the year at the $5,300 level.
Disclaimer: This analysis is for informational purposes only and does not constitute financial advice. Trading gold involves significant risk.