
Gold is sitting at a decision point. After a sharp two-day selloff that dragged price from the $5,200 area down toward the low $5,100s, XAU/USD has spent the past 24 hours grinding sideways — and that consolidation is starting to resolve in favour of the bulls.
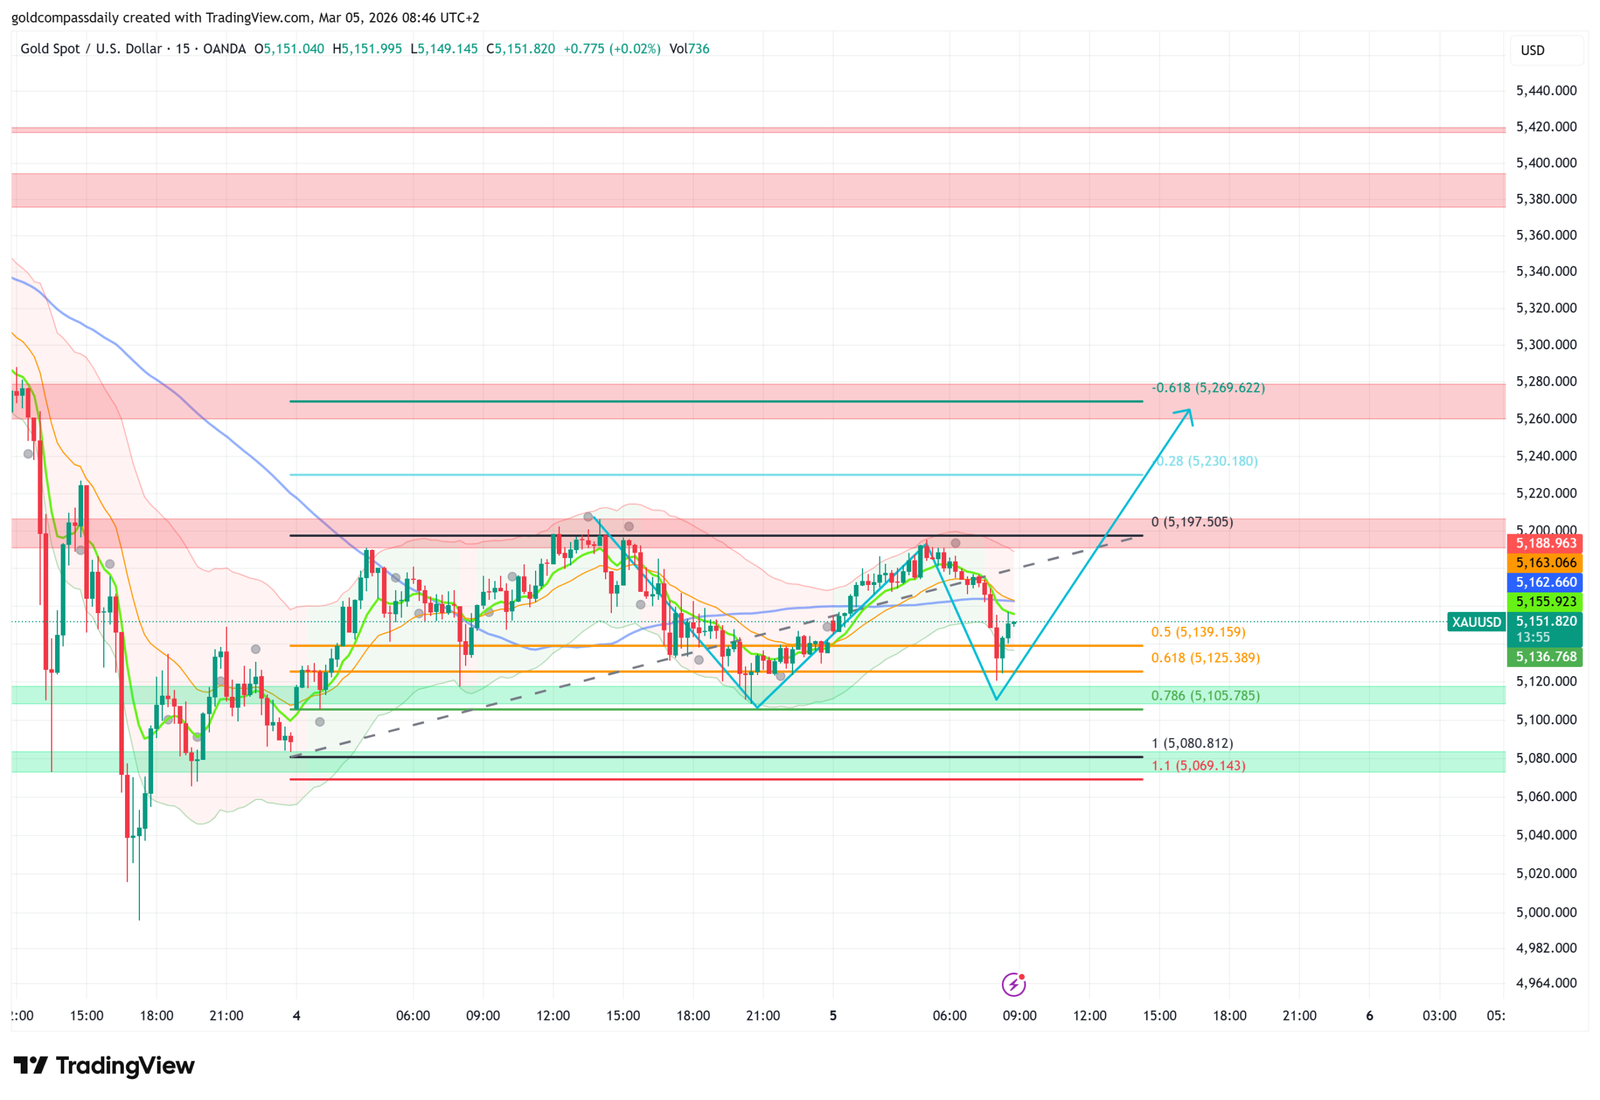
The 15-minute chart tells a clear story: price is reacting to the 0.5 Fibonacci retracement level at $5,139.159, with buyers stepping in each time sellers push toward that zone. The structure looks constructive. What happens next depends on whether gold can break above a very specific ceiling.
The Setup: Fibonacci Holding, Structure Tightening
The Fibonacci grid is drawn from the recent swing high at $5,197.505 (0 level) down to the swing low at $5,069.143 (1.1 extension). Right now the 0.5 level at $5,139 is acting as immediate support — it has held on multiple tests, and each bounce from it is printing a slightly higher low.
The Bollinger Bands on the 15-minute chart have narrowed considerably over the past several hours. That kind of compression typically precedes a directional move. Combined with price sitting on Fibonacci support and an upward-sloping trendline still intact beneath the consolidation, the technical picture is tilting bullish — but confirmation has to come from price itself.
Two Scenarios to Watch
Bullish Scenario
Price holds above $5,139.159 (Fib 0.5), builds a higher low, and breaks through $5,197.505 — the Fibonacci 0 level and the top of the two-day consolidation range. The chart shows multiple rejections from that zone during the March 4 session, so a convincing close above it would be a meaningful structural shift. That is the primary target for this setup.
Bearish Scenario / Invalidation
If price loses $5,105.785 (Fib 0.786), that’s the first serious warning. A close below $5,080.812 (Fib 1.0) invalidates the setup entirely. That level marks the full retracement of the measured move — below it, the bullish structure is gone and sellers are back in control.
Key Levels at a Glance
- Support: $5,139.159 (Fib 0.5) → $5,125.389 (Fib 0.618) → $5,105.785 (Fib 0.786)
- Primary Target: $5,197.505 — breakout of the consolidation range
- Invalidation: Close below $5,080.812 (Fib 1.0)
- Bias: Bullish above $5,139 — invalidated below $5,080
Watch how price handles the $5,197 area in the hours ahead. That is the line between a confirmed breakout and another failed attempt at the top of the range. Below $5,080, the setup no longer exists.
Analysis based on the XAU/USD 15-minute chart as of March 5, 2026, 08:46 UTC+2. This is technical analysis for educational purposes only and does not constitute financial advice.