
One More Dip Before the Rally? Gold Eyes $5,085 Before a Push Toward $5,143
Gold came into Friday under pressure. After failing to hold gains above $5,143 during the March 6 Asian session, XAU/USD pulled back sharply — and the 15-minute chart now points to one more test of a key Fibonacci level before buyers potentially take back control.
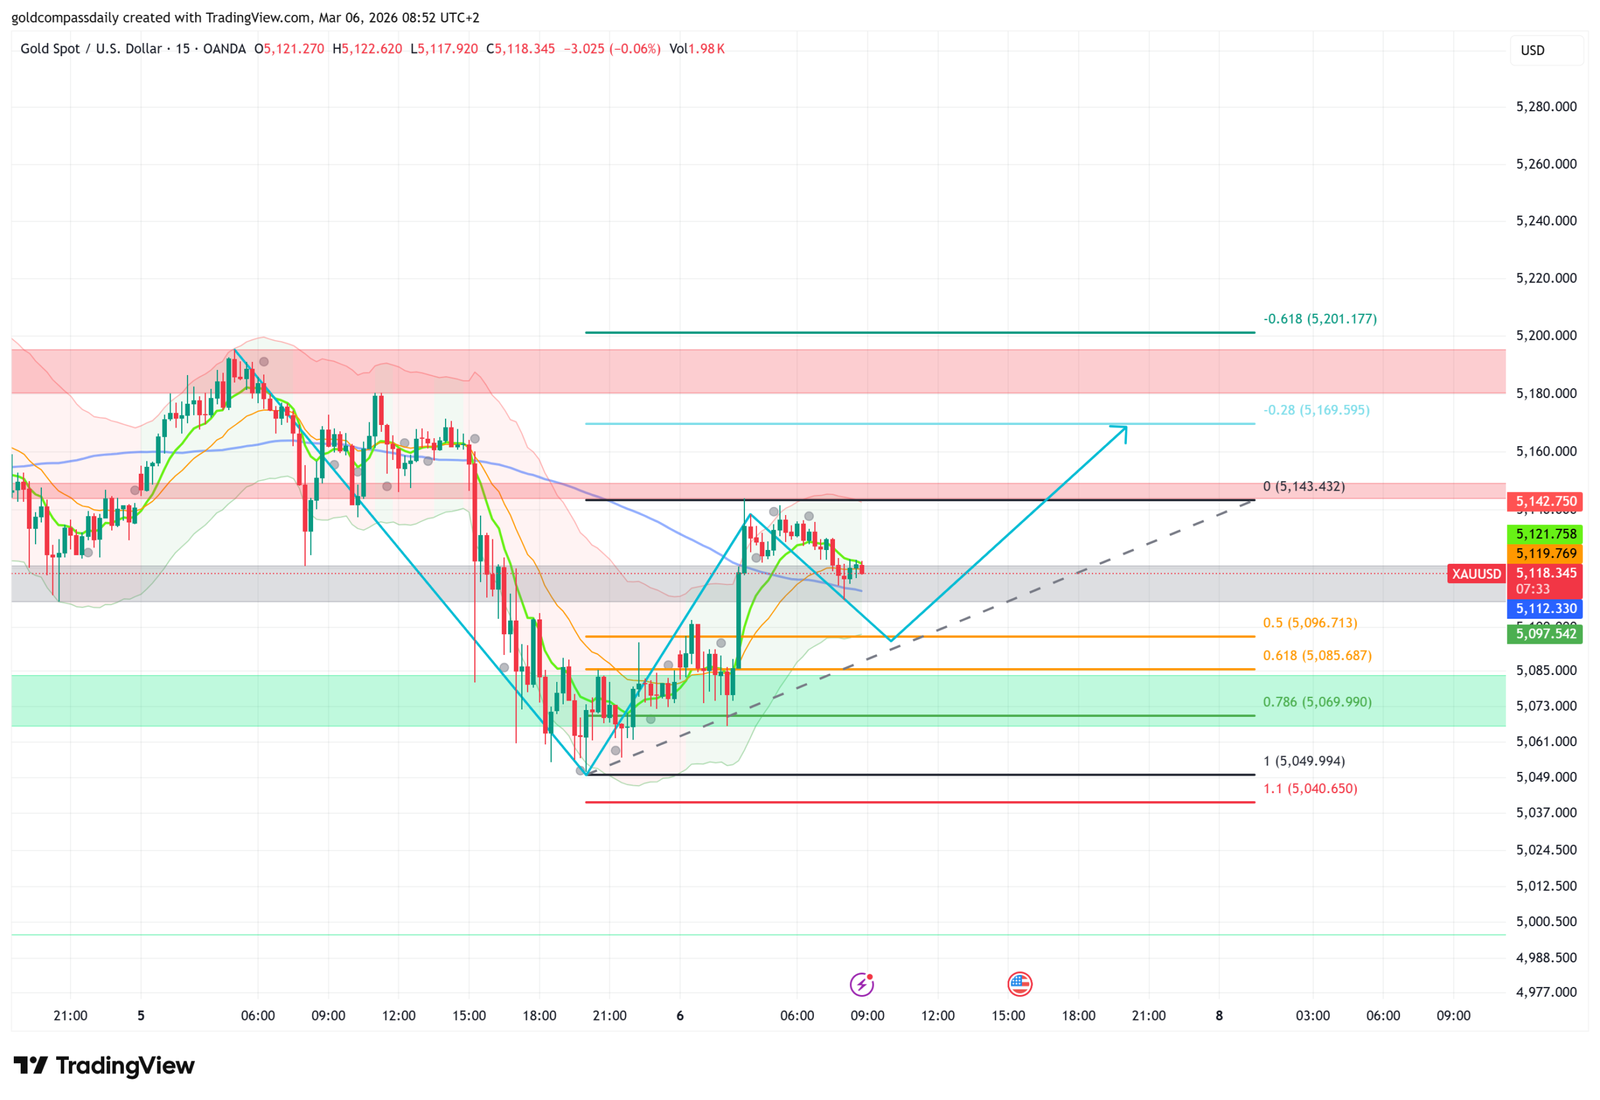
Price is currently trading around $5,118, sitting just below the Fibonacci 0 level at $5,143.432 — the horizontal resistance that has capped every recovery attempt since the selloff began on March 5. The structure is clear: lower highs, a defined support cluster in the $5,085–$5,069 zone, and a projected path that revisits that support before any meaningful move higher.
The Fibonacci Structure
The grid on this chart is drawn from the swing low at $5,040.650 (1.1 extension) up to $5,143.432 (0 level). That gives a clean set of retracement levels across a roughly $100 range, and right now the market is navigating the middle of it.
The 0.5 level at $5,096.713 offered temporary support during the early March 6 session, but price has since slipped back below it. The next meaningful floor is the 0.618 at $5,085.687 — and that is where the setup begins. A touch of that level, followed by a reaction, would set up the move the chart is projecting.
Below $5,085, the 0.786 at $5,069.990 is the last line before the green demand zone that has repeatedly attracted buyers. A clean hold anywhere in the $5,085–$5,069 range keeps the bullish scenario intact.
The Setup: Dip to $5,085, Then a Push Toward $5,143
The projected path on the chart is a zig-zag: price dips into the $5,085.687 zone, finds support, then reverses higher toward $5,143.432 — the Fib 0 and the cap of the current consolidation range. Break that, and the -0.28 extension at $5,169.595 opens up as the next target. The -0.618 at $5,201.177 sits beyond that, just inside the pink resistance band visible on the chart.
The upward-sloping dashed trendline running beneath current price reinforces this read. As long as that trendline holds, the structure favours a bounce from the Fibonacci cluster rather than a continuation lower.
Bullish Scenario
Price dips to $5,085.687 (Fib 0.618), holds, and reverses. A recovery through $5,096.713 (Fib 0.5) followed by a break above $5,143.432 (Fib 0) confirms the move. First extended target is $5,169.595 (-0.28 extension).
Bearish Scenario / Invalidation
A break and close below $5,069.990 (Fib 0.786) invalidates the setup. That level is the last structural defence before the demand zone collapses — losing it signals that buyers are not showing up where they should, and the projected recovery toward $5,143 is off the table.
Key Levels at a Glance
- Resistance: $5,143.432 (Fib 0) → $5,169.595 (-0.28) → $5,201.177 (-0.618)
- Support: $5,096.713 (Fib 0.5) → $5,085.687 (Fib 0.618) → $5,069.990 (Fib 0.786)
- Primary Target: $5,143.432 — breakout of the consolidation range
- Invalidation: Close below $5,069.990 (Fib 0.786)
- Bias: Cautiously bullish — but only after a confirmed hold at $5,085
The next few hours are the test. If gold holds the $5,085–$5,069 zone without breaking $5,069, the recovery toward $5,143 stays on. A close below $5,069 changes the picture entirely.
Analysis based on the XAU/USD 15-minute chart as of March 6, 2026, 08:52 UTC+2. This is technical analysis for educational purposes only and does not constitute financial advice.