
Gold Pulls Back Into Fibonacci Support — $5,177 Back in Play
Gold opened the new week under pressure. After a sharp intraday spike toward $5,177.581 during the March 9 Asian session, XAU/USD reversed hard and is now trading around $5,101 — giving back nearly the entire move in a matter of hours. The 15-minute chart shows the pullback is approaching a critical Fibonacci cluster, and how price reacts there will determine whether this week starts with a recovery or a deeper slide.
The Structure: Sharp Spike, Sharp Reversal
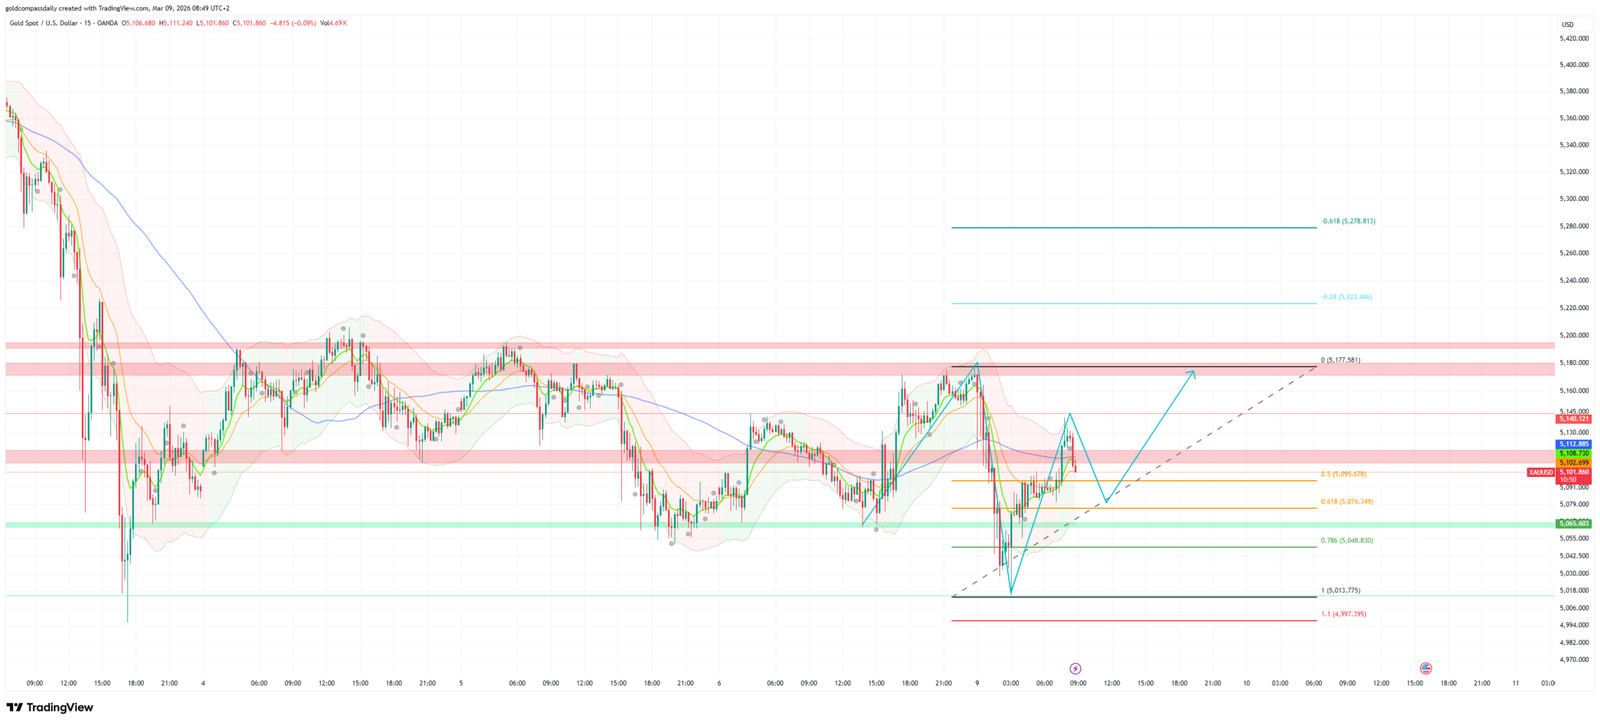
The move on this chart is textbook. Price rallied from the $5,048 area all the way to $5,177.581 — the Fibonacci 0 level and the top of the pink resistance band that has capped gold throughout the past week. The rejection from that zone was immediate and aggressive, which tells you sellers are still active at those highs.
The Fibonacci grid is drawn from the swing high at $5,177.581 (0) down to $4,997.195 (1.1 extension). Price is currently cutting through the middle of that grid, and the next meaningful level below is the 0.618 retracement at $5,076.349 — sitting just above the green demand zone that has provided support multiple times over the past several days.
The Setup: Dip to $5,076, Then a Push Back Toward $5,177
The projected path on the chart is straightforward: one more leg lower into the $5,076.349–$5,048.830 Fibonacci zone, a hold, and then a reversal back toward the session high at $5,177.581. The upward-sloping dashed trendline running beneath current price supports this read — as long as it holds, the bias remains that buyers will show up in the Fibonacci cluster.
The 0.5 level at $5,095.678 is the first test. If that gives way cleanly, the move into $5,076 (Fib 0.618) becomes the higher-probability scenario. A decisive hold anywhere in the $5,076–$5,048 zone sets up the long side for a recovery back through $5,095 and ultimately a retest of $5,177.
Bullish Scenario
Price finds support at $5,076.349 (Fib 0.618) or within the broader $5,076–$5,048 demand zone. A recovery above $5,095.678 (Fib 0.5) confirms the bounce is underway. Primary target is a full retest of $5,177.581 (Fib 0). A break above that opens the -0.28 extension at $5,227.868 and eventually the -0.618 at $5,278.813.
Bearish Scenario / Invalidation
A close below $5,013.775 (Fib 1.0) invalidates the setup. That level sits just below the green demand zone and the $5,048 Fib 0.786 — losing it means the demand zone has failed and the projected recovery is no longer in play. The 1.1 extension at $4,997.195 would then become the next downside reference.
Key Levels at a Glance
- Resistance: $5,177.581 (Fib 0) → $5,227.868 (-0.28) → $5,278.813 (-0.618)
- Support: $5,095.678 (Fib 0.5) → $5,076.349 (Fib 0.618) → $5,048.830 (Fib 0.786)
- Primary Target: $5,177.581 — full retest of the session high
- Invalidation: Close below $5,013.775 (Fib 1.0)
- Bias: Bullish from the $5,076–$5,048 zone — invalidated below $5,013
The setup is clean. Gold needs to find buyers in the $5,076–$5,048 Fibonacci cluster, hold, and push back through $5,095. If that sequence plays out, $5,177 is back on the table. A close below $5,013 and the week starts very differently.
Analysis based on the XAU/USD 15-minute chart as of March 9, 2026, 08:49 UTC+2. This is technical analysis for educational purposes only and does not constitute financial advice.