
Gold Bounces From Support — $5,190 in Sight After Yesterday’s Drop
Yesterday’s setup played out. Gold dropped from the $5,200 area, broke through the $5,185 trigger, and pushed all the way into the green demand zone — exactly as the chart projected. Now, with price bouncing from that support and trading around $5,166, the structure is shifting again. The question is no longer whether the drop happened, but how far the recovery can go.
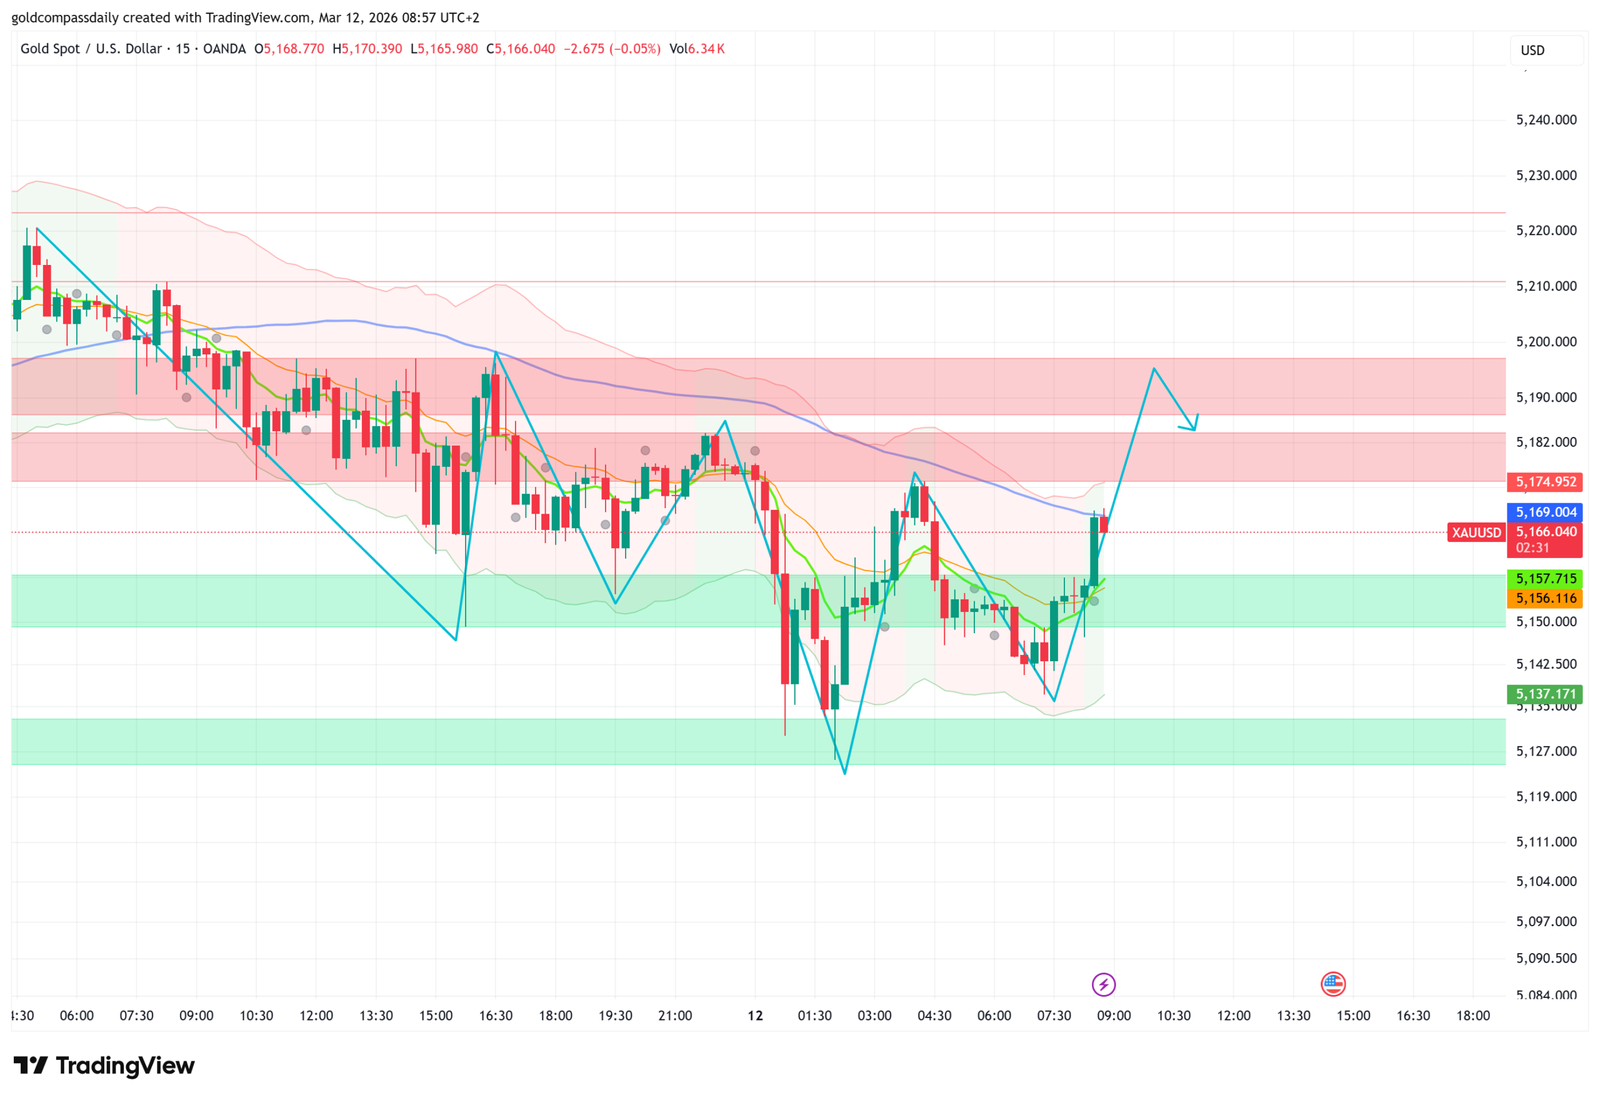
The 15-minute chart shows price breaking out of the green demand zone that sits between $5,137.171 and $5,157.715. The move off the lows is sharp and clean, moving averages are beginning to curl upward, and the Bollinger Bands are starting to expand to the upside. The early signs of a recovery are there — but there is a significant test ahead.
The Structure: Demand Zone Holds, Recovery Underway
The green zone on this chart has proven itself multiple times over the past week. Every time price has pushed into the $5,137–$5,157 area, buyers have stepped in. This morning is no different — the spike low printed near $5,127 during the early March 12 session, and the recovery has been immediate and sustained.
The challenge now is the pink resistance band sitting between roughly $5,174 and $5,200. That zone has capped price on multiple occasions and represents the main obstacle between the current price and any meaningful continuation higher. The projected move on the chart targets $5,190 — inside that pink band — as the near-term objective.
getting there requires price to hold above $5,157.715 on any pullback and push through the lower edge of the pink zone at $5,174.952. A clean break and hold above $5,174 shifts the bias firmly bullish for the session, with $5,200 as the primary target — a full break above the pink resistance band.
The Setup: Hold the Green Zone, Target $5,200
The projected path on the chart is a continued recovery from the green demand zone toward $5,200 — a full break above the pink resistance band that has capped price for the past two sessions. The move does not need to be straight up — a consolidation near $5,174 before a push through the pink zone is the more likely sequence.
The key is that the green zone holds on any retest. As long as price stays above $5,156.116, the bullish recovery scenario remains valid. A pullback into the $5,156–$5,157 area that finds support would actually strengthen the setup before the next leg higher.
Bullish Scenario
Price holds above $5,156.116, pushes through $5,174.952 (lower edge of the pink zone), and extends toward the primary target at $5,200 — a full break above the pink resistance band. That level has capped price repeatedly this week, so a clean close above it would be a meaningful structural shift.
Bearish Scenario / Invalidation
A close back below $5,156.116 invalidates the recovery setup. That level is the upper edge of the green demand zone — losing it means price has slipped back inside the support area and buyers are not following through. The next meaningful level lower is $5,137.171, and below that the $5,120 area.
Key Levels at a Glance
- Support / Entry Zone: $5,156.116 → $5,137.171 (green demand zone)
- First Resistance: $5,174.952 — lower edge of pink zone
- Primary Target: $5,200 — full break above the pink resistance band
- Invalidation: Close below $5,156.116 — exits the green zone
- Bias: Bullish above $5,156 — invalidated below that level
Yesterday the chart called for a drop. It happened. Today it is calling for a recovery toward $5,200. The green zone is holding, the structure is improving, and the pink band is the final test. Watch $5,174 first — then $5,200. A close below $5,156 and the setup is off.
Analysis based on the XAU/USD 15-minute chart as of March 12, 2026, 08:57 UTC+2. This is technical analysis for educational purposes only and does not constitute financial advice.