
Gold Near Session Lows — One More Dip Before the Recovery Toward $5,175
Gold has had a rough 24 hours. After failing to hold the $5,190 area on March 12, XAU/USD sold off sharply through the afternoon session, breaking below every support level in its path and hitting a low of $5,057 overnight. Price has since bounced back to around $5,089 — but the chart is not done with the downside yet before the real recovery begins.
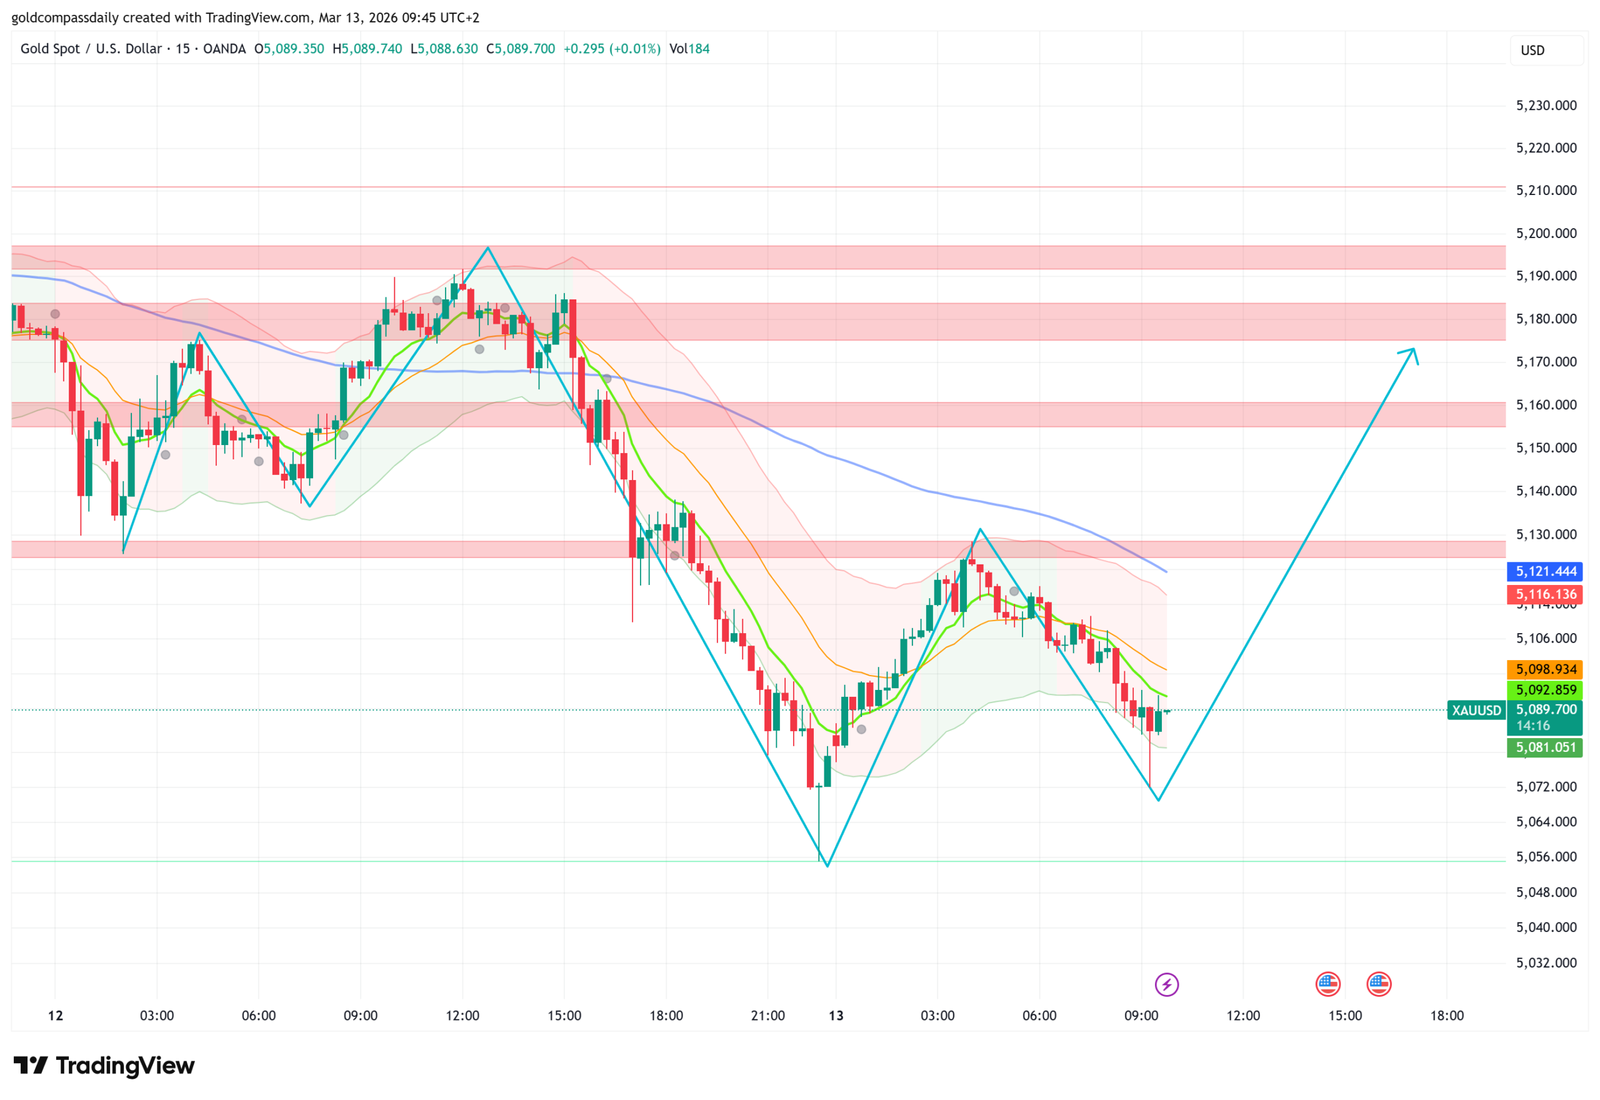
The 15-minute structure shows a classic pattern: a sharp drop, a partial recovery that fails to reclaim key resistance, and now one more push lower before buyers step in decisively. The projected path on the chart maps exactly this sequence — a final dip toward the $5,081 area, a hold, and then a sustained move higher toward $5,175.
The Structure: Lower Highs, One More Test Below
The bounce from the overnight low of $5,057 carried price back to $5,130 during the early March 13 Asian session — but that recovery stalled. Since then, price has made a series of lower highs and is now drifting back toward the $5,080s. The moving averages on the 15-minute chart remain pointed lower, and the Bollinger Bands are still expanded to the downside — signs that the corrective move has not fully exhausted itself.
The key support area is the $5,081.051 level — the current session low visible on the chart. That level aligns with the lower boundary of the most recent consolidation range and represents the last meaningful floor before the large green demand zone at $5,056. A clean hold at $5,081 is the trigger for the recovery move.
The Setup: Final Dip to $5,081, Then Rally to $5,175
The projected path on the chart is a dip back into the $5,081 area, a hold, and then a sharp recovery through the pink resistance bands toward $5,175 — the upper edge of the pink zone that has acted as both support and resistance throughout this week. That target represents a $90 move from the low, but the distance is consistent with the prior swings visible on the chart.
For the bullish scenario to activate, price needs to absorb the selling near $5,081 without breaking below $5,056. The green demand zone starting at that level has held on every meaningful test this week — it is the structural floor of the entire range.
On the way up, the first resistance is the lower pink band near $5,130. A clean break above that opens the path to the middle pink zone around $5,160, and from there the move toward $5,175 becomes the natural extension.
Bullish Scenario
Price dips to $5,081.051, holds, and reverses. A recovery above $5,116.136 confirms the bounce is underway. The move then targets the lower pink zone at $5,130, the middle pink zone at $5,160, and ultimately the primary target at $5,175 — the upper edge of the pink resistance band.
Bearish Scenario / Invalidation
A close below $5,081.051 invalidates the setup. That is today’s session low — if price breaks through it rather than holding, the recovery scenario is off the table and the next support is the green demand zone at $5,056.
Key Levels at a Glance
- Dip Target / Entry Zone: $5,081.051 — session low and final support before green zone
- Confirmation Level: $5,116.136 — recovery above here signals bounce underway
- Resistance Levels: $5,130 (lower pink) → $5,160 (mid pink) → $5,175 (primary target)
- Primary Target: $5,175 — upper edge of the pink resistance band
- Invalidation: Close below $5,081.051 — today’s session low
- Bias: Bullish above $5,081 — invalidated on a close below that level
The week has been volatile, but the structure has been consistent. Watch $5,081 — that is today’s line in the sand. Hold it and $5,175 is the target before the week closes. Lose it and the setup is done.
Analysis based on the XAU/USD 15-minute chart as of March 13, 2026, 09:45 UTC+2. This is technical analysis for educational purposes only and does not constitute financial advice.