
Gold opens the new week under modest pressure but finding support. Friday’s Non-Farm Payrolls delivered a number that surprised to the upside — pushing XAU/USD from the $4,765 area back to the current level of $4,658 as the stronger labour market data temporarily reinforced the dollar and reduced near-term Fed cut expectations. The 15-minute chart shows price consolidating just above the $4,650–$4,657 support zone, with the projected path showing one final dip to $4,650 before a recovery toward $4,748+. Today’s calendar is the lightest of the week — but China’s inflation data, published overnight, delivered two significant beats that provide a constructive backdrop for the recovery attempt.
The Chart: NFP Shock Being Absorbed, Recovery Setup Building
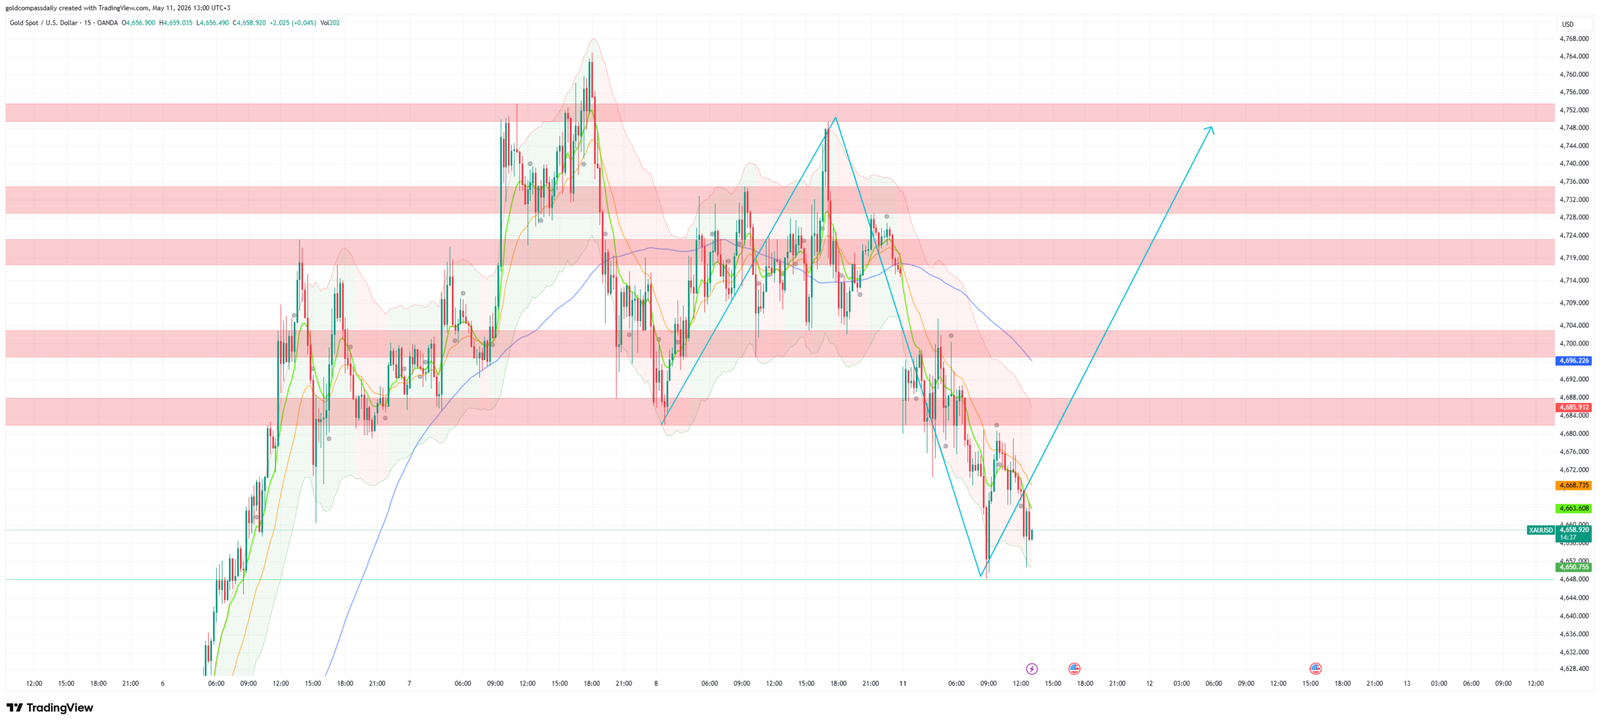
The 15-minute chart shows the aftermath of Friday’s payrolls surprise. The drop from $4,765 to the session low of approximately $4,649 was sharp but has already stabilised. Price is currently holding above the $4,650.735 support level — the lower boundary of the current consolidation range. The multiple pink resistance bands between $4,663, $4,688, $4,692, $4,700, $4,704, $4,709, $4,719, $4,724, $4,728, $4,732, $4,736, and $4,752 map the sequential resistance levels that the recovery will need to work through on the way back toward the week’s highs.
The projected path shows a final dip to $4,650 — completing the post-NFP consolidation — before a sharp reversal toward $4,748+. That move would need to clear the pink resistance cluster between $4,688 and $4,704 as the first meaningful hurdle, and then the denser resistance band between $4,719 and $4,736 before the $4,748 target comes into view.
The floor is $4,650.735. A close below that level opens the $4,628–$4,632 area. Above $4,663.912, the recovery is underway and the sequential resistance levels become the targets.
Friday’s NFP: What Actually Happened
Friday’s Non-Farm Payrolls came in significantly above the 65K consensus forecast — delivering a number that challenged the narrative of a Liberation Day-driven labour market deterioration. The beat was sufficient to strengthen the dollar, push gold lower, and push back rate cut expectations. However, the market’s reaction — a $116 decline from $4,765 to $4,649 rather than a catastrophic selloff — is telling. Gold gave back approximately half the week’s gains on a significant data beat. That resilience suggests the structural demand for gold — tariff inflation, geopolitical uncertainty, safe-haven positioning — is absorbing what would previously have been a much larger correction.
The key question entering this week is whether Friday’s strong payrolls represents genuine US economic resilience or a final lagged reading before the Liberation Day tariff impact shows up in employment data. The answer will come progressively through May’s data — this week’s CPI on Tuesday and Thursday’s claims will be the next inputs.
China CPI and PPI: The Morning’s Dominant Data Points
The overnight session delivered two significant beats from China that provide the most important fundamental context for gold at the start of this week.
China CPI y/y printed at 1.2% — above the forecast of 0.9% and the prior 1.0%. Chinese consumer prices are accelerating modestly — the first above-forecast CPI reading from China in several months. For gold, Chinese CPI acceleration has two implications: first, it signals that Chinese domestic demand is stronger than feared, supporting physical gold demand from the world’s largest consumer; second, it reduces the likelihood of aggressive PBoC easing, which is modestly CNY-positive and reduces the safe-haven demand channel from Chinese financial stress.
China PPI y/y printed at 2.8% — dramatically above the forecast of 1.7% and the prior 0.5%. Chinese producer prices jumping from 0.5% to 2.8% year-on-year is a significant inflationary signal — and in the context of Liberation Day tariffs, it is almost certainly tariff-driven. Chinese manufacturers are paying dramatically more for inputs, and those costs will eventually be passed through to export prices and ultimately to US import prices. This is the global tariff inflation transmission mechanism in action: Liberation Day tariffs raise Chinese production costs, which raises global goods prices, which feeds into US CPI in the coming months.
The China PPI beat at 2.8% is the single most important inflation data point of the morning — it directly validates gold’s structural bull case as a tariff inflation hedge. When Chinese producer prices are rising at nearly 3% per year, global goods inflation is coming. Gold prices that inflation.
AUD/USD impact: China CPI and PPI beats are dual positives for the Australian dollar — stronger Chinese domestic demand supports commodity exports, and higher Chinese production costs signal continued industrial activity. AUD should outperform in the Asian and early European session on this data.
Copper and industrial metals: China PPI at 2.8% signals strong factory input cost pressure — consistent with ongoing industrial activity that supports base metals demand. Copper faces a positive demand signal from this data.
EUR/USD: China data has limited direct EUR impact, but the global inflation signal from China PPI supports the case that tariff-driven price increases are a global phenomenon — reducing the ECB’s ability to cut aggressively while growth slows. Modestly EUR-positive through the reduced ECB dovishness channel.
Cleveland Fed Inflation Expectations: The US Inflation Gauge
The Cleveland Fed Inflation Expectations are published tentatively today, with the prior reading at 3.1%. This model-based measure of where the Cleveland Fed estimates inflation expectations are running provides a real-time complement to the UoM Inflation Expectations (4.7% last week). A Cleveland Fed reading above 3.1% — confirming that US inflation expectations are rising — would be a dual gold signal: hawkish Fed (near-term headwind through dollar) but inflationary (medium-term tailwind through inflation hedge demand). Given China PPI at 2.8% and last week’s UoM Inflation Expectations at 4.7%, a Cleveland Fed reading above 3.1% would be entirely consistent with the data trend.
5:00pm — Existing Home Sales: The Housing Market Pulse
Existing Home Sales at 4.05M (prior 3.98M) — a modest expected improvement in US housing market activity. An improvement from 3.98M to 4.05M would signal that the housing market is gradually recovering from the elevated mortgage rate pressure — a mildly positive economic signal. A reading significantly above 4.1M would be a genuine beat that adds to Friday’s NFP in building the “US economy is resilient” narrative. A miss below 3.9M would add to the growth slowdown narrative and be mildly gold-supportive.
In the current context — where gold is consolidating after Friday’s NFP beat and China PPI is signalling global tariff inflation — the Existing Home Sales reading is a secondary input. It matters more for USD direction in thin Monday liquidity than as a primary gold driver.
The Week Ahead: Tuesday CPI Is the Key
Today’s thin calendar is a deliberate pause before one of the most data-intensive weeks of May. Tuesday brings US CPI — the most watched single data release for gold. After last week’s ISM Prices at 74.0 and China PPI at 2.8%, the April CPI reading will be the first direct measure of whether Liberation Day tariff costs are showing up in US consumer prices. If CPI comes in above the March reading — particularly if Core CPI accelerates — the stagflation signal becomes explicit and gold’s bull case receives its most powerful data confirmation of the year.
Thursday brings Retail Sales and PPI, and Friday closes with Industrial Production. The week is structured to answer the central question of May: is the US economy slowing (gold supportive through growth concern) or is it holding up with rising prices (gold supportive through inflation hedge) — or both simultaneously, the stagflation scenario that is gold’s most bullish fundamental backdrop?
Key Levels and Market Summary
- Gold (XAU/USD): $4,658 · Dip target $4,650 · Resistance sequence $4,663 → $4,688 → $4,700–$4,704 → $4,719–$4,736 · Target $4,748+ · Floor $4,650 · China PPI at 2.8% = structural bull case reinforced · Tuesday CPI is the week’s defining event
- China PPI at 2.8%: The most important data point of the morning · Tariff inflation transmission confirmed · Global goods price inflation incoming · Gold’s inflation hedge narrative validated
- EUR/USD: Light European calendar today · China data provides mild EUR support · Monday thin liquidity limits moves · Tuesday’s US CPI and European CPI data drive the week’s EUR direction
- AUD/USD: China CPI + PPI double beat = AUD positive · Commodity demand signal supports the pair · Outperforms G10 in thin Monday session
- USD/JPY: NFP beat = pair elevated · China inflation signal = mild risk-on = yen mild pressure · Existing Home Sales at 5:00pm is the afternoon driver · Thin Monday = amplified moves
- S&P 500 / Nasdaq: NFP beat absorbed positively · China PPI suggests input cost pressure building for US corporates · Existing Home Sales at 5:00pm provides afternoon direction · Tuesday CPI is the week’s equity risk event
- Copper: China PPI at 2.8% = strong industrial activity signal = copper demand positive · Outperforms other commodities today
- WTI Crude: Light calendar = moves with broader risk sentiment · China demand signal positive · Liberation Day retaliatory tariff risk remains the structural headwind
- Gold week setup: NFP beat created the dip · China PPI confirms the inflation hedge case · $4,650 is the floor · Tuesday CPI above March reading = gold breaks above $4,748 · $4,860 retest is May’s objective
Gold at $4,658 on a light Monday is not a weak market — it is a market absorbing Friday’s NFP beat while China overnight delivered the most important inflationary data point of the week. The $4,650 support holds the structure intact. China PPI at 2.8% tells us where tariff inflation is heading. Tuesday’s US CPI tells us how fast it is arriving. The dip to $4,650 is the setup. Tuesday’s CPI is the catalyst. The path to $4,748 and beyond is defined.
Analysis based on the XAU/USD 15-minute chart as of May 11, 2026, 13:00 UTC+3. Economic data sourced from the daily macro calendar. This article is for informational and educational purposes only and does not constitute financial advice.