
XAU/USD trades at $4,576.35 on the 15-minute chart, up 0.26% on the day, as price action confirms a bullish reversal from a well-defined demand zone ahead of key U.S. economic releases.
Market Summary
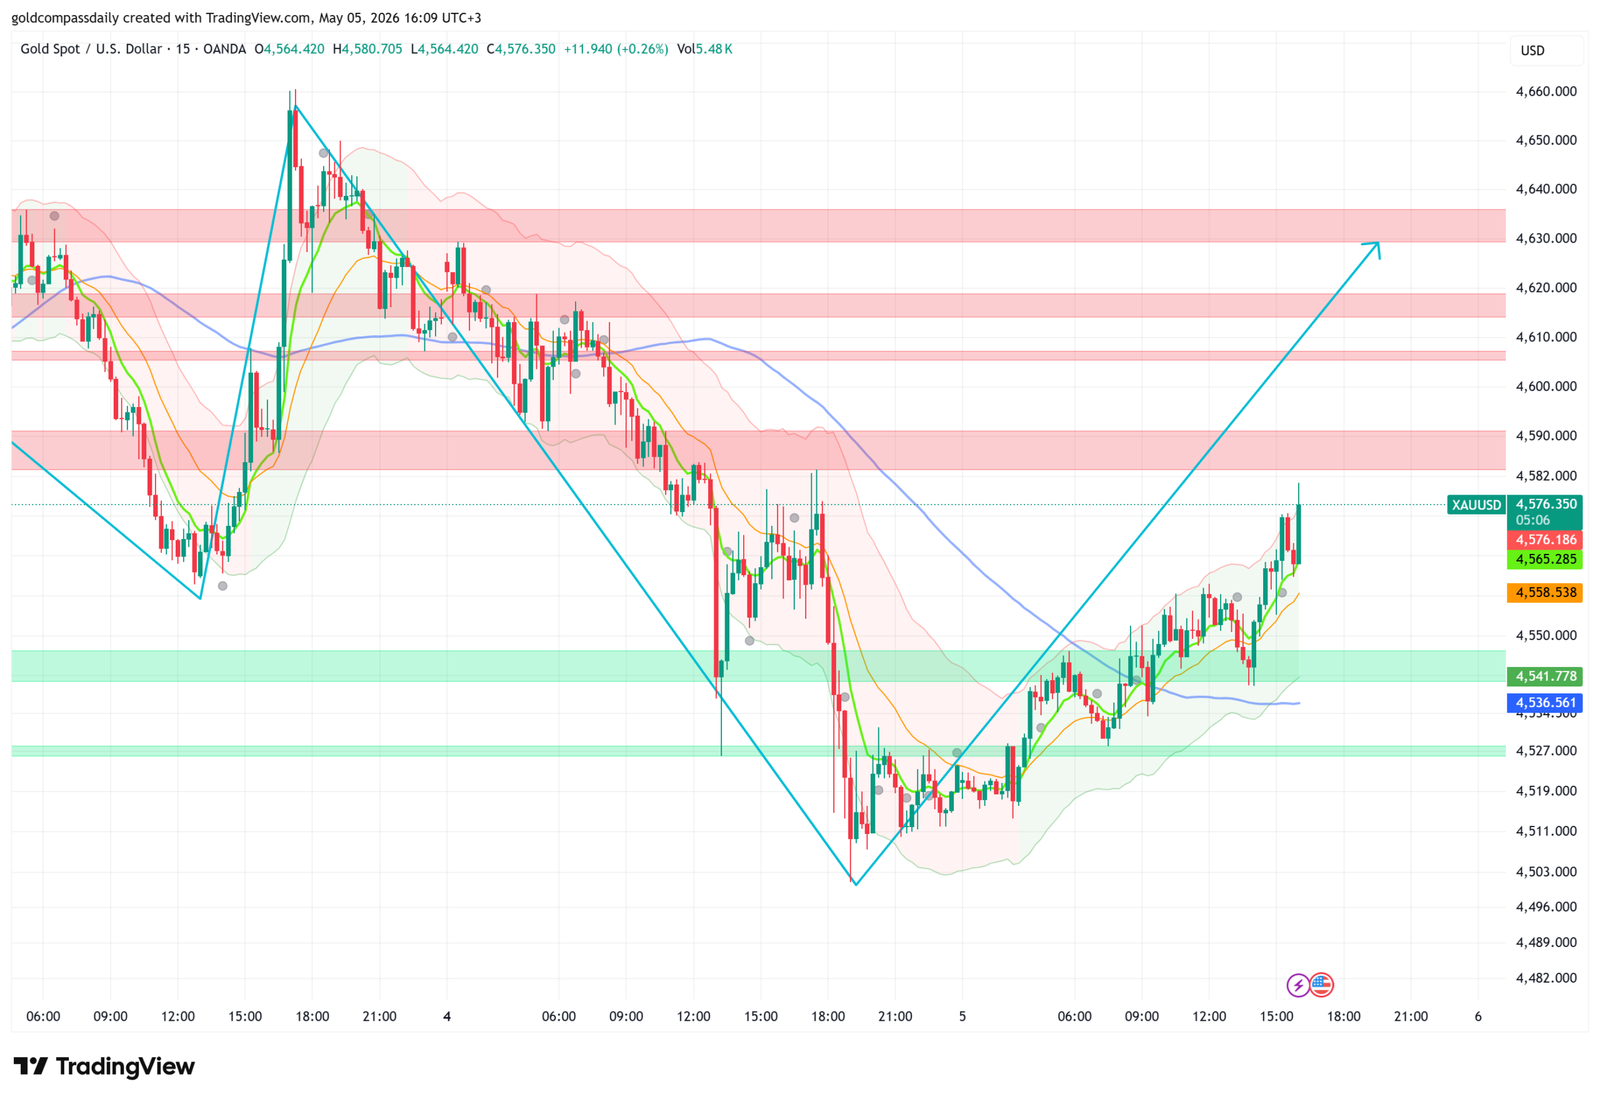
Gold spot (XAU/USD) staged a decisive recovery on Tuesday, May 5, bouncing firmly off a key support confluence between $4,527 and $4,541 following a steep two-day sell-off that dragged prices from a session high of approximately $4,660 — reached during Monday’s Asian session — all the way down to an intraday low near $4,503. As of the 16:09 UTC+3 snapshot on the 15-minute chart, gold is quoted at $4,576.35, representing a gain of $11.94, or +0.26%, on the day.
The recovery has been orderly and technically significant. Price has reclaimed all major short-term moving averages — with the fast exponential moving average now reading $4,576.19, the medium-term average at $4,565.29, and the slower trend average at $4,558.54 — suggesting that short-term momentum has shifted decisively in favor of the bulls. The Bollinger Bands, which had been contracting during the base-building phase, are now beginning to expand to the upside, confirming the emerging breakout.
Technical Picture: Support Confirmed, Resistance Ahead
The chart structure drawn on the 15-minute timeframe shows a clear V-shaped recovery. After a prolonged distribution phase and cascading sell-off through the European and early U.S. sessions on May 4, gold found its footing in a green-shaded demand zone between $4,527 and $4,541 — a level that had previously acted as a pivot point in late April trading. The low of the move printed near $4,503, just below this zone, which may represent a liquidity sweep before buyers stepped in aggressively.
Since the reversal, price has advanced in a series of higher lows, with the projected bullish trajectory — illustrated by the diagonal blue arrow on the chart — pointing toward a test of the $4,620–$4,630 resistance band. This zone, highlighted in pink on the chart, aligns with previous consolidation from the April 3–4 session and represents the next meaningful obstacle for the bulls. A clean break above $4,630 would open the path toward $4,660 and potentially new all-time highs.
On the downside, immediate support rests at $4,541.78 (the upper edge of the demand zone), with a secondary floor at $4,527. A break below $4,503 would negate the current bullish thesis and shift the bias back to neutral-to-bearish.
Fundamental Backdrop: Event Risk Elevated into U.S. Session
Tuesday’s economic calendar carries a significant amount of event risk for gold, particularly from the U.S. side. The most impactful releases scheduled for the afternoon session (Eastern Time) include the ISM Services PMI at 5:00 PM local time, with consensus expecting a reading of 53.7 — a slight dip from the prior 54.0 but still firmly in expansion territory — and JOLTS Job Openings, forecast at 6.86 million versus a prior 6.88 million. Both readings will be closely scrutinized for any signals regarding the strength of the U.S. labor market and the Federal Reserve’s rate path.
Also due are the U.S. Trade Balance figures, with the deficit expected to widen to -$60.3 billion from a prior -$57.8 billion, and comments from FOMC Members Bowman and Barr, both of whom are scheduled to speak later in the session. Any hawkish tilt from Fed officials — particularly regarding the timeline for rate cuts — could pressure gold by strengthening the U.S. dollar, while dovish signals would likely add further fuel to the ongoing recovery rally.
On the international front, Japan and China observed bank holidays today, reducing liquidity across Asian markets during the overnight session — a factor that may have amplified the volatility seen in gold earlier in the session. The Reserve Bank of Australia held its Cash Rate steady at 4.35%, in line with expectations, and accompanied the decision with its Monetary Policy Statement and a subsequent press conference, keeping AUD-denominated commodity proxies in focus. The ECB’s Christine Lagarde is also scheduled to speak, adding potential euro-zone volatility to the mix.
Context: A Two-Day Correction Within a Larger Uptrend
The sell-off from Monday’s highs near $4,660 to today’s lows at $4,503 represents a correction of approximately $157, or roughly 3.4% — a notable but not unusual retracement in the context of gold’s extraordinary run over the past several months. The broader trend remains emphatically bullish, underpinned by persistent central bank buying, geopolitical uncertainty, ongoing questions about U.S. fiscal sustainability, and a global de-dollarization narrative that has driven institutional and sovereign demand for the metal to multi-decade highs.
The pattern visible on the 15-minute chart — a sharp rally, a structured distribution, a deep corrective flush, and now a base-building recovery — is consistent with the “accumulation after pullback” phases that have characterized gold’s advance throughout 2025 and into 2026. Each of these corrections has ultimately resolved to the upside, and the technical structure today suggests this episode is following the same script.
Outlook
With price firmly back above all short-term moving averages, Bollinger Bands expanding to the upside, and the bullish trajectory targeting $4,620–$4,630, the near-term bias for XAU/USD is constructive. However, traders should exercise caution into the U.S. afternoon session, where the combination of ISM Services PMI, JOLTS, and Fed speaker commentary could introduce sharp two-way volatility.
A confirmed hourly close above $4,582 — the dotted horizontal level visible on the chart — would strengthen the bullish case considerably and bring the $4,600 psychological level into play. Conversely, any failure to hold above $4,541 on a pullback should be treated as a warning sign that the recovery is losing steam.
Markets will also be watching the broader risk environment closely. Equities, the U.S. dollar index, and Treasury yields all remain key co-factors that will influence gold’s direction heading into the rest of the week, with Friday’s U.S. Non-Farm Payrolls report looming as the next major macro event on the calendar.
Disclaimer: This article is for informational purposes only and does not constitute financial advice. Trading precious metals involves significant risk. Always conduct your own research and consult a qualified financial advisor before making investment decisions.