

Gold trades cautiously bullish at $4,165 following a sharp intraday reversal from $4,177, with the metal digesting gains from a session low of $4,118 as markets await key U.S. and Canadian sentiment data in the North American afternoon. The immediate structure favours a continuation higher provided support at $4,156 holds, but a confirmed close above $4,188 is required before the $4,200 supply zone comes back into play.
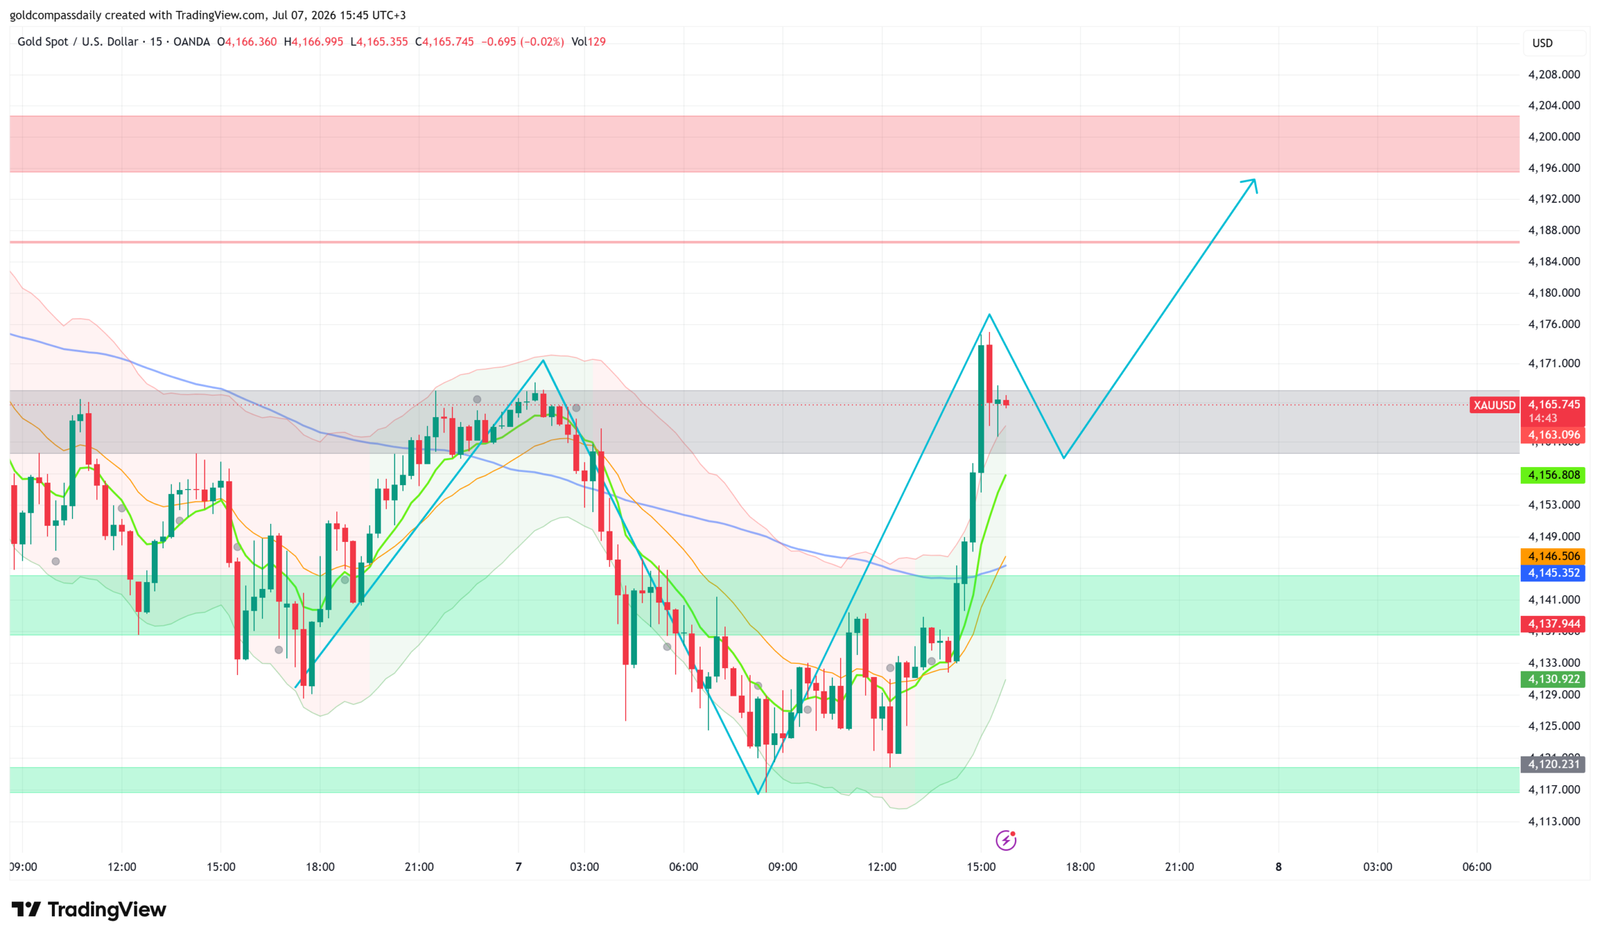
Key Levels
- Bias: Bullish above $4,156
- Support: $4,156 → $4,145 → $4,130
- Resistance: $4,177 → $4,188 → $4,196–$4,204 (supply zone)
- Session target: $4,192–$4,196 (conditional on hold above $4,156 and soft U.S. sentiment data)
- Invalidation: Below $4,145 = short-term bullish structure broken, retest of $4,130 likely
Catalyst of the Day
The primary catalyst for Tuesday’s remaining North American session is the RCM/TIPP Economic Optimism Index, due tentatively in the U.S. afternoon, with a consensus forecast of 45.0 against a prior reading of 42.5. A reading that falls short of the 45.0 consensus — or that surprises to the downside — signals deteriorating consumer confidence in the U.S. economic outlook, which historically weighs on the dollar and provides a tailwind for gold as a non-yielding safe-haven asset. The Ivey PMI from Canada (forecast 59.1 vs. prior 58.2) is a secondary input: a beat reinforces commodity-linked risk appetite that can spill into gold, while a miss adds to the cautious macro tone already supporting the metal. Traders watch the 5:00 PM UTC+3 window for the first definitive directional signal into the close.
Fundamental Context
Gold’s advance toward $4,200 earlier in the session reflects a confluence of factors that remain structurally intact: dollar softness, residual demand for safe-haven assets amid unresolved trade policy uncertainty, and positioning ahead of this week’s Federal Reserve communications. As Gold Compass Daily’s weekly hub analysis outlined, the FOMC Minutes and Fed Governor Warsh’s commentary represent the dominant macro events for the July 6–10 window. Markets continue to price a degree of Fed caution, and any data that reinforces the case for delayed rate action — such as a soft TIPP optimism reading — directly benefits gold by reducing the opportunity cost of holding the non-yielding metal.
The broader picture has not materially changed since Monday’s session. As Gold Compass Daily’s Monday analysis noted, the $4,156 level has emerged as the defining short-term pivot — a zone that was tested, held, and now underpins Tuesday’s recovery structure. The API Weekly Statistical Bulletin, due at 11:30 PM UTC+3, is a secondary oil-market catalyst that may carry indirect implications for inflation expectations and, by extension, for gold’s real-yield calculus. The GDT dairy auction print of -2.8% (prior) remains a commodity-market softness signal but holds limited direct relevance for gold.
Chart Analysis
The 15-minute XAU/USD chart presents a textbook V-shaped recovery: price bottomed at approximately $4,118 in the early Asian session on July 7, staged a near-vertical rally to $4,177, and has since pulled back to consolidate between $4,163 and $4,167. The short-term green moving average has turned sharply higher and is now acting as dynamic support at $4,156, while the slower blue moving average remains flat and slightly declining — a configuration consistent with an early-stage intraday recovery that has not yet confirmed a full trend resumption. The $4,177 rejection sits just below the $4,188 horizontal resistance level visible on the chart; the gap between those two levels defines the near-term battleground. A horizontal pink resistance line at $4,188 and a broader red supply zone stretching from $4,196 to approximately $4,204 represent the structural ceiling the chart’s projected path — marked by a blue arrow — is targeting. The consolidation at current levels resembles a bull-flag compression: tight range, declining candle size, and price holding above the rising short MA. A sustained push above $4,170 on volume would be the first confirmation that the consolidation is resolving higher rather than rolling over.
Bull / Bear Scenarios
Bull Scenario
Trigger: Price holds above $4,156 and breaks above $4,177 on a 15-minute close. Target: $4,188 initial, with extension to $4,196–$4,200 if U.S. TIPP optimism misses consensus. A soft RCM/TIPP print accelerates the move as dollar softness compounds the technical breakout.
Bear Scenario
Trigger: Price fails at $4,177 again and closes a 15-minute candle below $4,156. Target: $4,145 initially, then $4,130 if selling accelerates. A TIPP beat above 45.0 that lifts the dollar would validate the downside case and risk unwinding the entire intraday recovery.
Events Ahead
- Tuesday, ~17:00 UTC+3 — CAD Ivey PMI (forecast 59.1, prior 58.2): A strong Canadian PMI adds to commodity demand signals; a miss reinforces caution and mild safe-haven support for gold.
- Tuesday, ~17:00 UTC+3 (Tentative) — USD RCM/TIPP Economic Optimism (forecast 45.0, prior 42.5): The session’s primary catalyst — a miss below 45.0 weakens dollar sentiment and supports gold; a beat risks short-term profit-taking from current levels.
- Tuesday, 23:30 UTC+3 — USD API Weekly Statistical Bulletin: Oil inventory data affecting energy-linked inflation expectations; indirect but relevant for the real-yield framework underpinning gold.
- Wednesday — FOMC Minutes (exact time TBC): The week’s dominant event; any dovish tone or acknowledgment of downside growth risks would deliver the most significant directional impulse for gold this week.
Analysis based on the XAU/USD 15-minute chart as of July 7, 2026, 15:45 UTC+3. This article is for informational and educational purposes only and does not constitute financial advice.