

Market Snapshot
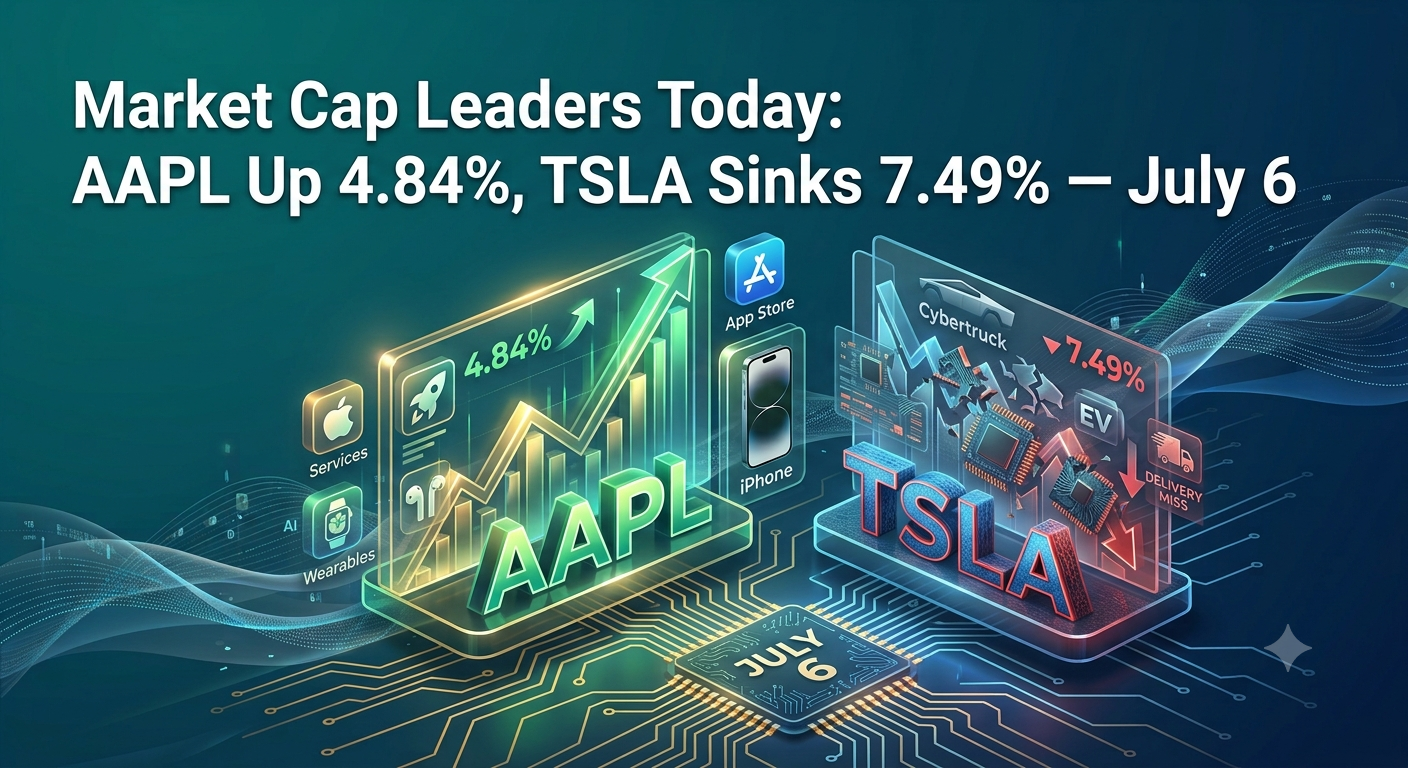
Technology names dominate today’s mega-cap action with a sharp directional split as Apple (AAPL) gains +4.84% to lead the field higher, while Tesla (TSLA) posts the session’s deepest loss among trillion-dollar names, shedding -7.49% in a classic sell-the-news reaction following a record Q2 delivery beat. Nvidia (NVDA), the world’s largest company by market capitalization, trades slightly lower at -1.39%, keeping the overall tone among mega-caps mixed with sector-level divergence rather than a broad directional sweep. SpaceX (SPCX), which officially joins the Nasdaq-100 before the open on July 6, adds +2.83% on the eve of its index inclusion — a structural catalyst generating significant forced passive buying into a historically low-float stock.
Top Market Cap Leaders — Price Action
- NVDA — Nvidia Corporation: $4.719T market cap, $194.83 (-1.39% today) — Nvidia drifts marginally lower in a broad semiconductor giveback session. The stock remains well within its 52-week range of $157.34–$236.54 and trades at a trailing P/E of 29.84x.
- AAPL — Apple Inc.: $4.533T market cap, $308.63 (+4.84% today) — Apple posts the session’s standout gain among mega-caps. Reports citing plans for at least five new iPhone models and expanded production targets for a foldable device, first reported by Nikkei Asia, contributed to renewed investor enthusiasm around the iPhone product cycle and the broader AI hardware upgrade thesis. The stock trades at a P/E of 37.41x and sits near the upper end of its 52-week range of $201.50–$317.40.
- SPCX — Space Exploration Technologies Corp.: $2.134T market cap, $162.00 (+2.83% today) — SpaceX advances ahead of its Nasdaq-100 inclusion effective July 7, which is expected to trigger an estimated $4.3 billion in mechanically compelled buying from QQQ and related index-tracking funds. With only approximately 3–5% of total shares in the public float, the supply-demand dynamic surrounding the rebalance is unusually concentrated. The company does not report a current earnings-based P/E ratio, reflecting its recent IPO status and the early-stage conversion of its operating divisions — Connectivity (Starlink), Space, and AI — to public market reporting standards.
- TSLA — Tesla, Inc.: $1.478T market cap, $393.45 (-7.49% today) — Tesla posts its worst single-session decline in nearly a year. The selloff follows a Q2 2026 delivery report that meaningfully exceeded analyst expectations — 480,126 deliveries against a consensus near 406,600 — but the stock had already priced in a strong result through a multi-day pre-announcement rally. Tesla trades at a trailing P/E of 361.20x, a multiple that reflects investor positioning on the autonomous driving, robotaxi, and AI narrative rather than near-term vehicle margin fundamentals. Q2 financial results are scheduled for July 22.
- MU — Micron Technology: $1.102T market cap, $975.56 (-5.49% today) — Micron gives back ground with a loss of $56.72 per share on heavy volume of 61.8M versus its 3-month average of 51.5M. The stock trades at a trailing P/E of 22.02x and remains well within its 52-week range of $103.38–$1,255.00. No confirmed company-specific catalyst was available at session time; the move aligns broadly with semiconductor sector pressure on the day.
- INTC — Intel Corporation: $604.879B market cap, $120.35 (-5.25% today) — Intel drops $6.67 on above-average volume of 125.0M against a 3-month average of 137.5M. The stock does not carry a current trailing P/E ratio, indicating negative trailing earnings on a TTM basis. Intel’s 52-week range of $18.97–$142.35 highlights the scale of the stock’s recovery from multi-year lows. A top analyst at TipRanks was reported earlier this week to have raised Intel’s price target by 100%, citing the foundry business thesis; the stock’s session direction on July 6 runs counter to that developing constructive narrative without a confirmed specific catalyst.
- NFLX — Netflix, Inc.: $326.969B market cap, $77.65 (+4.66% today) — Netflix gains $3.46 on volume of 55.5M, above its 3-month average of 41.6M. The stock trades at a P/E of 25.08x and sits near the top of its 52-week range of $70.86–$129.50. No confirmed catalyst was available at session time.
- PLTR — Palantir Technologies: $309.972B market cap, $129.30 (+2.84% today) — Palantir adds $3.57 with volume broadly in line with recent averages. The stock carries a trailing P/E of 145.35x, the highest earnings-based multiple among the confirmed-earnings names in this dataset, reflecting sustained investor premium for its enterprise AI and government data platform business. Palantir’s 52-week range is $106.37–$207.52.
- VZ — Verizon Communications: $177.712B market cap, $42.56 (+1.36% today) — Verizon advances modestly, trading at a P/E of 10.36x — the lowest confirmed multiple among the top-10 market cap names in this dataset. The stock sits mid-range within its 52-week span of $38.39–$51.68.
- T — AT&T Inc.: $142.997B market cap, $20.58 (+0.49% today) — AT&T edges higher on lighter volume of 129.4M versus its 3-month average of 48.7M. The stock carries a P/E of 6.88x and trades near the lower end of its 52-week range of $19.89–$29.79.
- NOK — Nokia Oyj: $67.381B market cap, $12.07 (-6.51% today) — Nokia declines $0.84 on volume of 78.3M, ahead of its 3-month average of 113.6M. The stock’s P/E of 80.70x stands as an elevated multiple for a legacy telecommunications equipment company, reflecting either transitory earnings compression or restructuring-related distortion in the trailing figure. No confirmed catalyst was available at session time.
- NU — Nu Holdings Ltd.: $66.168B market cap, $13.61 (+1.64% today) — Nu Holdings advances modestly at a trailing P/E of 21.00x. The digital banking group trades in the lower portion of its 52-week range of $11.20–$18.98.
- RIVN — Rivian Automotive: $25.018B market cap, $18.63 (+8.44% today) — Rivian posts the session’s largest single-stock percentage gain among this dataset’s names. The EV maker carries no trailing P/E ratio, consistent with its ongoing path to profitability. Per published Q2 EV delivery data, Rivian delivered 12,194 vehicles in Q2 2026, beating Street estimates of approximately 11,000 units, and raised its full-year guidance range to 65,000–70,000 vehicles — developments that appear to underpin today’s outperformance.
- SOFI — SoFi Technologies: $23.397B market cap, $18.24 (-1.08% today) — SoFi gives back ground at a P/E of 41.00x. The stock’s 52-week range of $14.92–$32.73 shows it currently trading in the lower half of that band.
Valuation Read
The most structurally notable valuation in this dataset is Tesla’s trailing P/E of 361.20x. At that multiple, the stock is not priced as an automobile manufacturer — Q2 delivery data confirmed 480,126 units, a strong operational result — but rather as an entity whose equity value is anchored to long-duration bets on autonomous driving commercialization, robotaxi deployments, and Optimus humanoid robot scale. The trailing multiple reflects what multiple sell-side analysts have characterised as a forward P/E in the region of 204x on FY2026 consensus estimates, meaning the valuation gap relative to near-term earnings remains extremely wide. Palantir’s trailing P/E of 145.35x is similarly elevated in absolute terms, though its AI platform growth rates and expanding government and commercial contract base are the factors routinely cited by analyst commentary to contextualise the premium.
At the other end of the spectrum, AT&T’s P/E of 6.88x and Verizon’s 10.36x stand as the dataset’s lowest confirmed multiples, consistent with the mature, high-yield, capital-intensive profile of legacy US telecommunications. Nokia’s P/E of 80.70x merits attention as an outlier for a company in a similar sector — at that multiple, the trailing earnings figure is likely compressed by restructuring costs or one-time items rather than reflecting the underlying normalised earnings power of the business. Intel trades with no current trailing P/E, meaning the company is running negative trailing earnings on a TTM basis; that status, combined with the stock’s extreme 52-week range ($18.97–$142.35), signals that the market has been in active price discovery on whether its foundry pivot can deliver a credible earnings recovery. SPCX and several smaller-cap names in this dataset also carry no current P/E, consistent with negative or pre-profitability earnings histories.
Note: The data source for this article does not include PEG ratio or analyst price target upside columns. Analysis is accordingly limited to price action, market capitalisation, P/E ratio (TTM), and confirmed external catalyst reporting. The valuation commentary above reflects the data available in the source screenshot.
Analyst Target Divergence
Analyst consensus price target data was not available in the source dataset for this article. Gold Compass Daily notes for reference that, based on published external analyst commentary as of the reporting date: Apple carries a range of analyst targets spanning approximately $290 to $400, with Wedbush maintaining a $400 target and Bank of America and Melius Research citing targets of $380 and $385 respectively per prior published reports — all attributable to those institutions’ analyst consensus, not to Gold Compass Daily. Intel’s analyst target situation is in active revision; a TipRanks-reported note cited a 100% price target increase from at least one top analyst tied to the foundry thesis, though the stock’s session performance on July 6 diverged from that constructive positioning. Tesla’s Q2 earnings report on July 22 will be the next significant reset event for analyst consensus.
Sector Concentration
Six of the top ten names by market capitalisation in this dataset — Nvidia, Apple, SpaceX, Tesla, Micron, and Intel — sit within the broad technology and technology-adjacent hardware universe, with Palantir and Netflix extending that concentration further. That density means the combined index weight of these names creates a structural dependency: broad US equity index performance, particularly the Nasdaq-100, is highly sensitive to synchronised moves within this group. Today’s session illustrates both the upside and downside of that concentration — Apple’s nearly 5% gain partially offsets Nvidia’s and Tesla’s combined losses in index-weighted terms, but a scenario in which AI hardware names, EV names, and semiconductor names all move in the same direction on the same day — as they have on multiple occasions in 2026 — produces outsized index-level volatility that is difficult to diversify away within a market-cap-weighted portfolio.
What to Watch
Tesla’s divergence between its confirmed delivery beat and its session selloff — the third consecutive quarterly delivery report on which the stock has declined — represents the most structurally notable disconnect in today’s dataset: a 18% delivery upside versus consensus, paired with a 7.49% share price decline, underscores that the stock’s directional drivers are now primarily anchored to earnings margin data and autonomy milestones rather than unit volume. The July 22 financial results are the next reset point. Separately, Intel’s absence of a trailing P/E — combined with a 52-week range that spans nearly $123 — makes it the dataset name with the widest unresolved valuation uncertainty heading into the second half of 2026.
Data based on market capitalisation, price action, and P/E ratio (TTM) as of July 6, 2026. Catalyst reporting sourced from CNBC, Nikkei Asia, and TradingKey as of the same date. This article is for informational and educational purposes only and does not constitute financial advice.