

Headline Thesis
Gold trades cautiously bullish at $4,156 — a post-holiday pullback from the $4,200 resistance zone has brought price back into the $4,149–$4,167 demand cluster, where the chart projects a recovery attempt into the U.S. session. The buy bias holds as long as the $4,149 support floor remains intact, with ISM Services PMI and Fed Governor Waller’s remarks serving as the session’s primary catalysts.
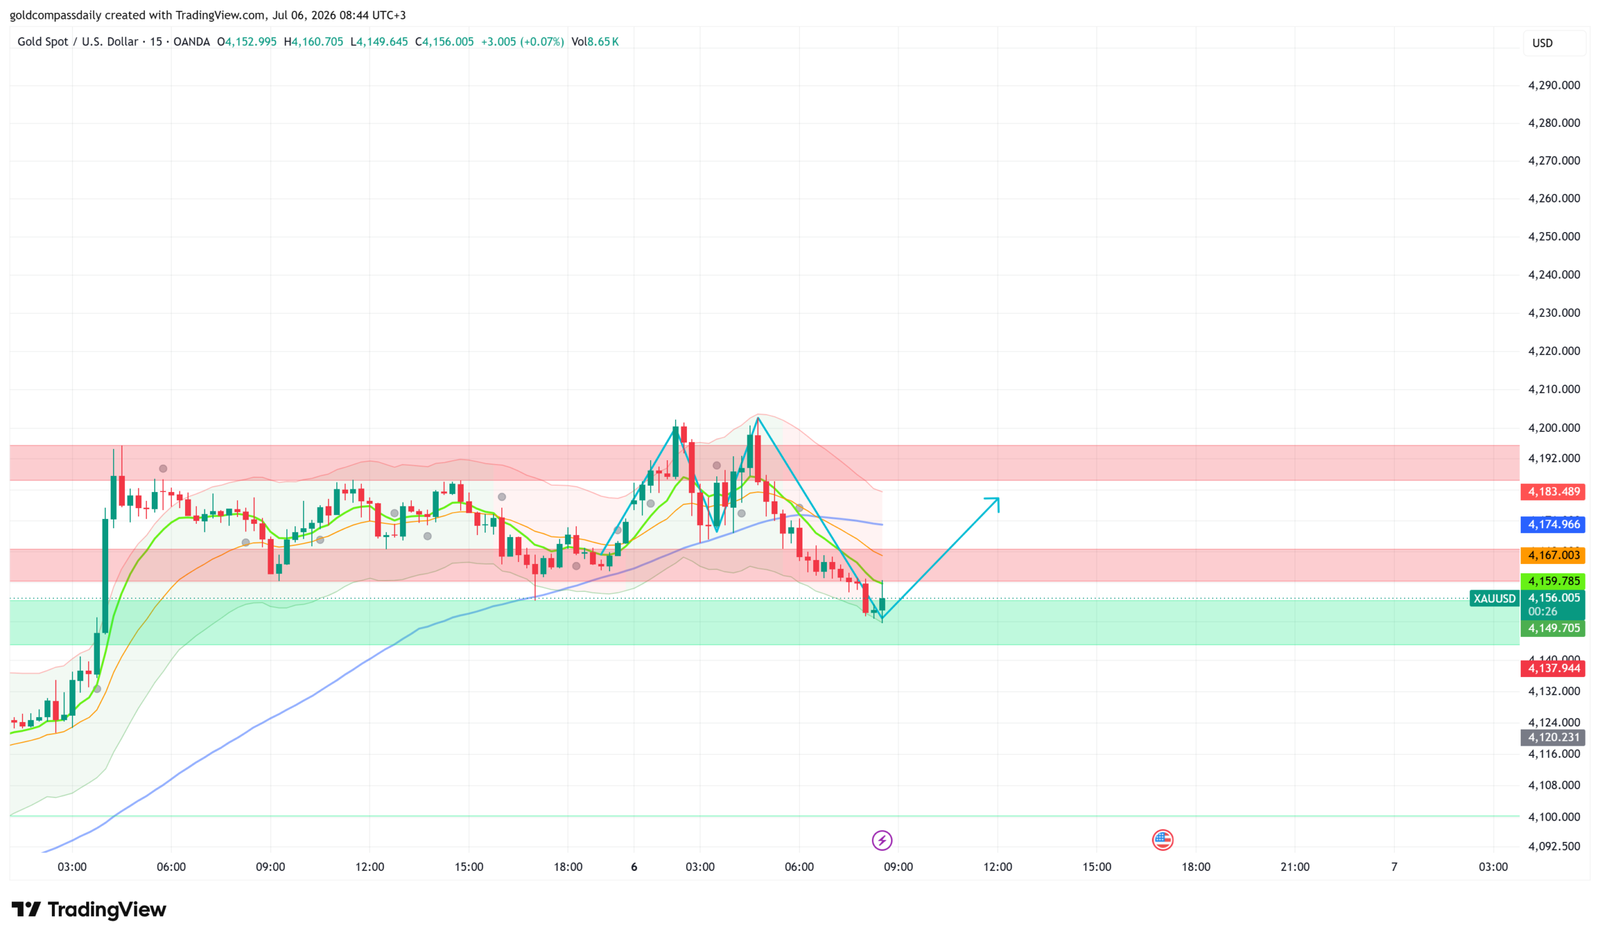
Key Levels
- Bias: Bullish above $4,149
- Support: $4,149 → $4,137
- Resistance: $4,167 → $4,183 → $4,192
- Session target: $4,183–$4,192 (conditional on ISM Services PMI miss and dovish Waller tone)
- Invalidation: Below $4,137 = demand structure failure, opens $4,120
Catalyst of the Day
The primary focus for Monday’s session falls on the ISM Services PMI at 17:00 UTC+3 and FOMC Member Waller’s remarks at 18:00 UTC+3. The ISM Services index carries outsized weight for gold this week — consensus sits at 54.5, and any reading that underperforms will revive Fed rate cut expectations, weakening the dollar and providing lift for XAU/USD. Waller’s tone is equally critical: as a known policy moderate, any language softening his stance on restrictive rates will be read as a dovish signal by the market, a direct tailwind for gold. Watch for initial price reaction on the ISM print at 17:00 UTC+3 and follow-through direction once Waller concludes at 18:00 UTC+3.
Fundamental Context
Gold’s retreat from $4,200 into the current consolidation zone reflects the market’s caution ahead of a data-heavy U.S. afternoon session rather than a structural shift in the trend. The broader macro environment — with the Fed still weighing the timing of rate cuts, the dollar trading without strong conviction, and geopolitical risk premium embedded in gold prices — continues to support the metal’s elevated range. The $4,149–$4,167 zone represents a healthy reset after the sharp two-day rally that pushed price from below $4,120 to test $4,205.
The European data calendar today offers limited direct drivers for gold. Eurozone Retail Sales came in at 0.2% against a prior contraction of -0.4%, and the Sentix Investor Confidence reading of -8.9 beat the prior -13.4 — both modestly positive for risk appetite but insufficient to move the needle on dollar dynamics. German Factory Orders missed expectations sharply (-3.8% actual vs. 1.1% forecast), reinforcing the narrative of slowing European industrial demand — a factor that historically strengthens the case for ECB easing and, by extension, supports gold as the dollar absorbs the relative divergence.
The week’s most significant macro event remains the FOMC Minutes — scheduled later in the week alongside commentary from Fed Chair nominee Warsh. That forward calendar is keeping institutional buyers engaged on dips. Any downside in today’s ISM Services PMI would front-run those expectations, providing the technical catalyst the chart’s projected recovery path requires.
Chart Analysis
The 15-minute XAU/USD chart shows price rallied sharply from the $4,120 area over the prior two sessions, reaching an intraday high above $4,205 before sellers capped the move near the $4,192–$4,200 resistance band — clearly marked as a supply zone on the chart. The subsequent pullback has brought price down to the $4,149–$4,156 area, which aligns with a green demand zone visible on the chart and sits just above the $4,149.71 support level. Moving averages are stacked in a moderately bullish configuration with shorter-period averages beginning to curl upward after the early session flush. The chart’s projected path — marked with a cyan arrow — shows the anticipated recovery trajectory targeting a return toward $4,183–$4,192 through the remainder of Monday’s session. The $4,167 level acts as the first internal resistance gate on that path. A failure to hold $4,149 would bring the $4,137 support into play, at which point the bullish recovery thesis would require reassessment.
Bull / Bear Scenarios
Bull Scenario
Trigger: Price holds above $4,149 through the London morning and ISM Services PMI prints at or below 54.0 → Target: $4,183, extension to $4,192. A dovish read from Waller adds momentum for a retest of the $4,200 resistance zone before the session close.
Bear Scenario
Trigger: Price breaks and closes below $4,137 on a 15-minute candle, particularly on a strong ISM Services beat above 55.5 → Target: $4,120, extension to $4,100. This would signal that the $4,200 rejection established a near-term top and that the rally from last week requires a deeper retracement before continuation.
Events Ahead This Week
- Monday, 17:00 UTC+3 — USD Final Services PMI (51.4 forecast): Confirms or revises the preliminary read; a downside miss weighs on the dollar and lifts gold.
- Monday, 17:00 UTC+3 — USD ISM Services PMI (54.5 forecast): The primary session catalyst — a miss below 54.0 directly boosts rate cut expectations and gold.
- Monday, 18:00 UTC+3 — FOMC Member Waller Speaks: Any softening of his rate stance is a direct tailwind for XAU/USD.
- Wednesday — FOMC Minutes: Full release of the June meeting deliberations; key for gauging internal Fed debate on cut timing — major volatility potential for gold.
- Wednesday/Thursday — Fed Chair Nominee Warsh: Market will parse every word for policy direction signals; gold highly sensitive to any dovish lean.
- Friday, 15:30 UTC+3 — USD CPI m/m: The week’s most consequential data point for gold — a print below 0.2% m/m would cement July cut expectations and likely push XAU/USD back toward $4,200+.
For the full week-ahead macro framework, including key levels and scenario analysis across each session, see the Gold Week Ahead: July 6–10 — FOMC Minutes and Warsh in Focus. Friday’s session context — which preceded the current consolidation — is covered in Gold Slips to $4,175 as Sellers Eye $4,100 on U.S. Holiday.
New York Session Update
Price Check
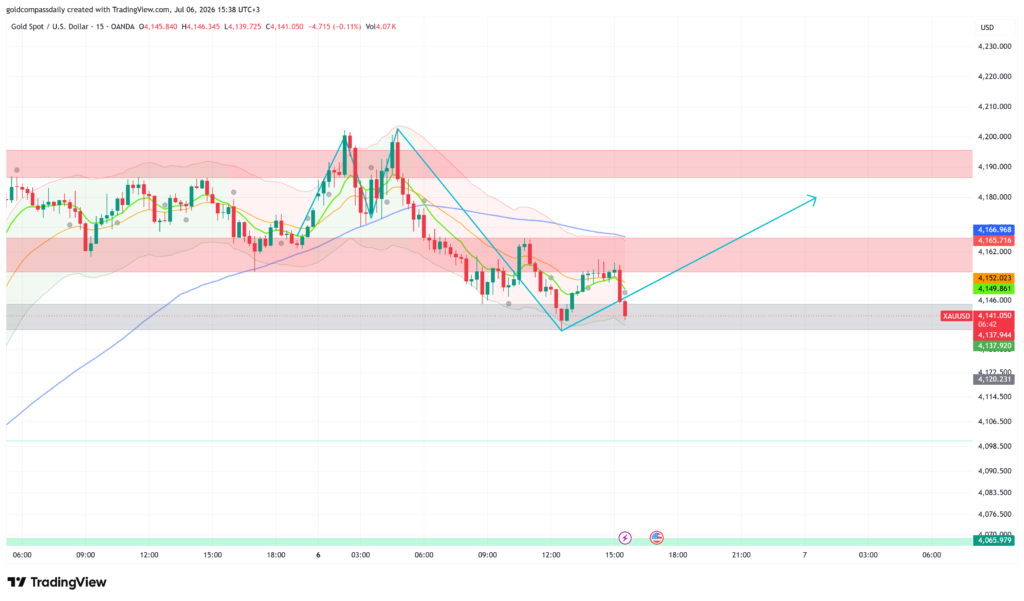
Gold is trading at $4,141 as the New York session gets underway — below the morning’s $4,149 support threshold, meaning the bullish invalidation level flagged in the morning analysis has been breached. The buy bias is now under pressure, with price having extended its pullback from the $4,200 area rather than staging the anticipated recovery toward $4,183.
What Changed
The ISM Services PMI printed at 50.8 for June — a meaningful miss versus the 54.5 consensus and the weakest reading in several months — which initially provided a lift to gold on dollar weakness. However, the move failed to sustain above the $4,162–$4,167 resistance cluster, and sellers reasserted control through the early New York hours, pushing price down through the $4,149 support level and into the $4,137–$4,141 zone. The rejection of the ISM-driven bounce at resistance is the key development since the morning: the data provided the right catalyst, but the technical structure did not follow through, suggesting overhead supply between $4,162 and $4,190 is heavier than the morning setup anticipated. FOMC Member Waller’s remarks are still pending at 18:00 UTC+3 and remain the final scheduled catalyst of the session.
Updated Levels
- Current price: $4,141
- Bias now: Neutral-to-cautiously bullish — morning invalidation level broken, but the chart projects recovery; bias only turns bearish on a close below $4,137
- Updated support: $4,137 → $4,122
- Updated resistance: $4,149 → $4,162 → $4,167
- NY session target: $4,162–$4,167 on a Waller-driven recovery; $4,122 on failure below $4,137
Scenarios Into the Close
Bull: Price holds $4,137 into the Waller remarks and dovish language pushes a reclaim of $4,149 → target $4,162, extension to $4,167.
Bear: Price closes below $4,137 on a 15-minute candle before or during Waller’s remarks → target $4,122, extension toward $4,100.
Chart Analysis
The 15-minute chart shows a clear two-leg decline from the $4,205 peak, with price now testing the grey horizontal support band around $4,137–$4,141 — a level that held as a floor during the prior consolidation phase visible in the chart’s left portion. Moving averages have crossed bearishly and are sloping downward, with the faster-period averages sitting well below the slower blue line, which is still angled upward from the multi-session trend. The chart’s projected path — marked with the cyan arrow — indicates an anticipated base formation near current levels followed by a recovery leg toward the $4,175–$4,180 area into the close and early Tuesday trade. The $4,122 level below represents the next significant structural support if the current floor gives way. A recovery above $4,149 is required to suggest the correction has run its course.
Analysis based on the XAU/USD 15-minute chart as of July 6, 2026, 08:44 UTC+3. This article is for informational and educational purposes only and does not constitute financial advice.