

Market Snapshot
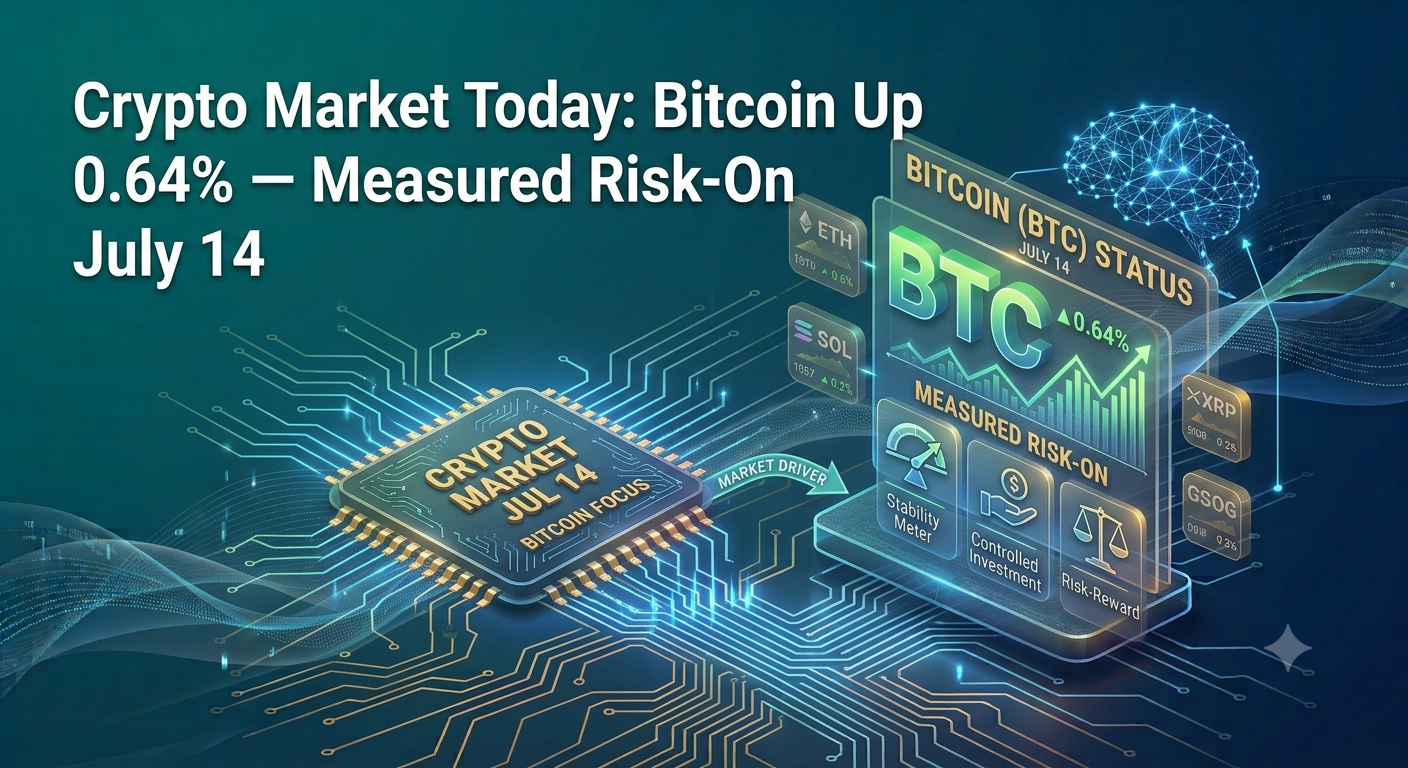
Crypto markets open with a measured risk-on tone on July 14 as Bitcoin trades at $62,632.42 (+0.64%), with broad green across the altcoin complex but gains tapering sharply from BTC down to Dogecoin, suggesting a Bitcoin-led session rather than a speculative altcoin surge. The uniform positive direction across all five major cryptocurrencies signals a constructive macro backdrop without the kind of outsized altcoin outperformance that would indicate a momentum-driven rotation away from Bitcoin. Ethereum’s marginal outperformance of BTC on a percentage basis is the one nuance worth watching as the session develops.
Price Overview
- Bitcoin (BTC): $62,632.42 (+0.64%, +$401.14) — Bitcoin’s modest but positive advance reinforces its role as the market’s anchor, with price holding above the psychologically significant $60,000 threshold and the positive session tone filtering into broader altcoin risk appetite.
- Ethereum (ETH): $1,786.22 (+0.75%, +$13.37) — Ethereum is marginally outperforming Bitcoin on a percentage basis today, a mild but notable sign of ETH-specific buying interest at a price level that remains well below the $2,000 mark that has acted as a structural pivot throughout recent cycles.
- Solana (SOL): $75.1647 (+0.42%, +$0.3107) — Solana is advancing but underperforming both BTC and ETH in percentage terms, a pattern consistent with a session where institutional capital anchors near the market’s largest assets rather than rotating into higher-beta layer-one alternatives.
- XRP: $1.0688 (+0.31%, +$0.0033) — XRP is posting the smallest percentage gain among the four major altcoins covered, trading just above the $1.00 psychological baseline with limited directional momentum, consistent with its tendency to lag in mild risk-on sessions while amplifying in breakout environments.
- Dogecoin (DOGE): $0.0720 (+0.16%, +$0.0001) — Dogecoin’s minimal advance at the tail of the leaderboard reflects subdued retail sentiment, with the meme-driven asset failing to attract the speculative enthusiasm that typically characterises the later stages of a risk-on rotation.
Bitcoin Analysis
Bitcoin’s position at $62,632 places it in one of the most consequential price zones of its current market cycle — comfortably above the $60,000 level that has served as a defining psychological threshold through multiple cycles but still well short of the all-time high territory above $73,000 that represented the cycle peak of the 2024 bull run. The $60,000 to $65,000 range has historically represented the intersection between long-term holder cost basis for portions of the supply accumulated during the 2020–2021 cycle and the lower boundary of what on-chain analysts have characterised as the premium zone for this cycle’s structural bull market.
From a macro perspective, Bitcoin continues to trade in an environment shaped by the Federal Reserve’s rate posture. The market has repriced its expectations for monetary easing multiple times since the inflation shock of 2022, and Bitcoin — which reached its cycle low near $15,500 in November 2022 before beginning its multi-year recovery — has demonstrated a high degree of sensitivity to the interest rate narrative. In an environment where the Fed has held rates at historically elevated levels for an extended period, BTC’s ability to hold above $60,000 reflects institutional demand that has matured beyond pure macro-rate sensitivity, driven in part by the structural change represented by the approval of spot Bitcoin ETFs in the United States in early 2024.
Those ETF inflows created a new sustained demand channel for Bitcoin that did not exist in previous cycles, compressing the asset’s typical drawdown depth and accelerating its recovery timeline. The consequence is a market structure that differs meaningfully from the 2017–2020 and 2020–2022 cycles: retail-driven parabolic advances followed by 80%+ drawdowns have been partially replaced by more institutionally anchored accumulation patterns, though the underlying four-year cycle framework tied to Bitcoin halving events remains a structurally relevant lens.
The most recent Bitcoin halving occurred in April 2024, reducing the block reward from 6.25 BTC to 3.125 BTC. Historically, the eighteen to twenty-four months following a halving have produced the most significant price appreciation of each cycle, and current price action at $62,632 — approximately fourteen months post-halving — is broadly consistent with the mid-cycle positioning seen in prior cycles before the terminal acceleration phase.
On the dominance question, Bitcoin’s modest outperformance by ETH today (+0.75% vs +0.64%) is not sufficient to indicate a decisive dominance shift, but the pattern of altcoins broadly posting gains while not dramatically outrunning BTC is consistent with a market where Bitcoin dominance remains elevated. A sustained altcoin season — defined by ETH, SOL, and XRP running materially faster than BTC on a sustained basis — typically requires Bitcoin dominance to be declining from a peak rather than holding near cycle highs. Today’s tepid altcoin outperformance is not yet that signal.
The $65,000 level represents the next significant resistance zone for Bitcoin, marking the approximate boundary of the congestion zone formed during the first half of 2024 prior to the cycle peak. A sustained close above $65,000 would shift near-term market structure from recovery-and-consolidation to potential breakout re-test of all-time highs. Conversely, a loss of the $60,000 level on a closing basis would reintroduce meaningful uncertainty into the bull case and likely trigger a broader altcoin pullback.
Ethereum Analysis
Ethereum’s position at $1,786.22 is analytically significant because it places ETH in a deeply contested zone relative to its own market history. The $2,000 level has functioned as a major structural pivot for Ethereum across multiple cycles — acting as resistance during the 2020–2021 accumulation phase, as a support level at various points during the 2021 bull run, and as a ceiling during the recovery from the 2022 bear market lows. The fact that ETH is currently trading below $2,000 reflects a cycle in which Ethereum has underperformed Bitcoin materially in relative terms, with the ETH/BTC ratio declining significantly from the highs set during the peak of Layer 2 and DeFi euphoria.
Today’s marginal ETH outperformance of BTC (+0.75% vs +0.64%) is a small positive signal for ETH bulls, but context is critical: the ETH/BTC ratio remains under pressure in structural terms, and a single session of minor outperformance does not indicate a trend reversal. For the ETH/BTC ratio to signal a genuine altseason-type rotation, Ethereum would need to sustain outperformance of Bitcoin over multiple sessions at meaningfully larger percentage differentials.
The Ethereum investment thesis continues to rest on several structural pillars that have not changed materially: the transition to proof-of-stake in September 2022 (the Merge) created a staking yield dynamic that removed a large portion of circulating supply from active sell pressure; the Layer 2 ecosystem has expanded significantly, with networks built on top of Ethereum processing the majority of transaction volume while ETH itself captures fee settlement value; and the approval of spot Ethereum ETFs in the United States in mid-2024 opened an institutional demand channel broadly analogous to what spot BTC ETFs provided for Bitcoin.
The critical question for Ethereum at current levels is whether $1,786 represents a base from which a recovery toward $2,000 and above can be sustained, or whether the ETH/BTC ratio’s extended period of underperformance reflects a more fundamental market reassessment of Ethereum’s relative value proposition in a world with multiple competing layer-one blockchains. That question will likely be resolved not by a single session’s price action but by the pattern of ETH/BTC over the coming weeks.
Key levels for Ethereum: the $2,000 mark is the immediate structural target on any continuation of today’s positive bias; $2,500 represents the next zone of historical significance; to the downside, $1,500 is the major support level that would represent a meaningful deterioration of the near-term bullish case.
Altcoin Round-Up: Solana, XRP, and Dogecoin
Solana
Solana at $75.1647 (+0.42%) is advancing modestly but lagging both Bitcoin and Ethereum in today’s session. From a structural perspective, SOL sits in the mid-range of its post-bear-market recovery, having recovered sharply from the lows below $10 reached during the collapse of the FTX exchange in late 2022 — an event that posed an existential short-term risk to Solana given FTX’s significant holdings of SOL. The subsequent recovery to the $70–$80 range represents both a testament to the network’s technical resilience and the growing developer and user base that has consolidated around Solana’s high-throughput, low-fee architecture.
The $75–$80 zone has functioned as a zone of contested support and resistance across multiple time frames in the current cycle. Solana’s key psychological thresholds lie at $100 to the upside — a round-number level that would signal a meaningful cycle re-acceleration — and $60 to the downside, which served as support during earlier phases of the current recovery. The network’s strength in DeFi, NFT activity, and more recently in consumer-facing crypto applications has given it a user base and fee revenue that differentiates it from earlier high-throughput layer-one networks that failed to build sustainable ecosystems.
Today’s underperformance relative to BTC and ETH is not unusual for SOL in sessions where the macro tone is positive but not euphoric — Solana tends to amplify directional moves, outperforming significantly in strong risk-on conditions and underperforming in more cautious sessions. The current pattern is consistent with a market that is constructive but not yet in acceleration mode.
XRP
XRP at $1.0688 (+0.31%) is posting the softest gain of the altcoin group covered today, holding a fraction above the $1.00 level that has served as a critical psychological anchor for the asset across its trading history. The $1.00 mark is significant not merely as a round number but as the level around which XRP consolidated for extended periods prior to the 2017 speculative surge, making it a historically meaningful reference point for both long-term holders and newer participants.
XRP’s market dynamic has been materially shaped by the multi-year legal proceedings between Ripple Labs and the U.S. Securities and Exchange Commission, which concluded with a partial ruling that provided meaningful regulatory clarity regarding XRP’s status in secondary market transactions. That development removed a significant overhang that had depressed XRP’s institutional adoption potential and allowed the asset to recover more freely. However, XRP’s price action remains sensitive to regulatory developments broadly — both positively, when clarity increases, and negatively, when broader crypto regulatory uncertainty returns.
The asset’s use case in cross-border payment corridors and its positioning as a settlement layer for financial institutions gives it a different fundamental profile from pure speculative assets like Dogecoin. In the current session, XRP’s modest gain is consistent with a market where risk appetite is positive but not euphoric — XRP tends to significantly outperform in strong risk-on environments when the payment corridor and institutional adoption narrative gains momentum. Key resistance for XRP lies at $1.20 and $1.50; support is found at $1.00 and $0.85.
Dogecoin
Dogecoin at $0.0720 (+0.16%) is the weakest performer of the session, advancing barely one basis point above flat. DOGE’s minimal gain today is analytically informative: as the asset most closely correlated with retail sentiment and social media-driven momentum, Dogecoin’s subdued performance indicates that the current session’s risk-on tone is institutional and measured rather than the kind of broad retail euphoria that drives speculative assets sharply higher.
Historically, Dogecoin moves in one of two modes: dormancy, where it grinds sideways with minimal volume and almost no directional movement as retail attention focuses elsewhere, and episodes of sharp acceleration driven by social media amplification, celebrity endorsement, or broader crypto mania that reaches retail audiences outside of traditional financial markets. Today’s +0.16% clearly represents the former — DOGE is participating in the market’s positive tone but drawing no incremental speculative demand.
Key levels for DOGE are straightforward: the $0.10 mark represents the critical psychological resistance that separates the asset’s dormant range from the zone associated with speculative interest. The current price of $0.0720 is well within the dormant range, and a move back toward $0.10 would require either a broad crypto acceleration or a specific sentiment catalyst. Support lies near $0.06 and $0.05, the latter marking the lower boundary of the asset’s established range in the current cycle.
Market Structure Read
The overall picture across Bitcoin, Ethereum, Solana, XRP, and Dogecoin today is one of broad but shallow positive movement — a pattern that analysts typically characterise as risk-on consolidation rather than breakout momentum. The key structural read is that today’s session is unambiguously Bitcoin-led: the market’s largest asset is setting the tone, and altcoins are following in a manner that is proportional to their place in the risk spectrum. ETH marginally outperforms BTC, SOL lags ETH, XRP lags SOL, and DOGE barely moves — a perfect hierarchy of risk appetite that reflects an institutional market rather than a retail-driven one.
This hierarchical pattern is actually a relatively healthy sign for the sustainability of the current positive move. Altcoin seasons characterised by the most dramatic gains — where small-cap and meme assets dramatically outperform Bitcoin — are typically associated with late-cycle speculative excess, not mid-cycle recovery. Today’s measured altcoin gains suggest the market is in accumulation or early recovery mode rather than the terminal speculative phase that precedes major corrections.
The macro correlation context is important. Crypto assets have shown a complex and evolving relationship with traditional risk assets like equities. In the 2020–2022 cycle, BTC and ETH developed a high correlation with the Nasdaq 100 during the tightening phase of the Fed cycle, selling off alongside growth equities as rates rose. As monetary conditions stabilise and institutional adoption of crypto as a distinct asset class deepens, that correlation has become less mechanical — but crypto remains sensitive to broad risk appetite shifts. A session where equity markets are constructive but not parabolic is consistent with the measured crypto performance observed today.
Gold’s concurrent performance is also relevant context for Gold Compass Daily readers. In the current environment, both gold and Bitcoin have benefited from institutional flows seeking assets outside the traditional equity-bond framework, though their drivers diverge at the margin: gold benefits most directly from geopolitical risk and dollar weakness, while Bitcoin’s institutional case rests more on the ETF-driven demand channel and the digital scarcity narrative. The two assets are not in competition for the same capital in the short term but are both expressions of a broader macro environment in which alternatives to fiat-denominated assets attract institutional interest.
BTC dominance remaining elevated is the key macro signal that separates the current market structure from a mature altseason. Until Bitcoin dominance begins a sustained decline from its current range, the market’s capital is consolidating around the largest and most liquid asset in the crypto complex — a pattern that historically precedes rather than follows the most significant altcoin runs.
Key Levels to Watch
- Bitcoin: Support $60,000 → $57,500 | Resistance $65,000 → $70,000
- Ethereum: Support $1,600 → $1,500 | Resistance $2,000 → $2,500
- Solana: Support $70.00 → $60.00 | Resistance $85.00 → $100.00
- XRP: Support $1.00 → $0.85 | Resistance $1.20 → $1.50
- Dogecoin: Support $0.06 → $0.05 | Resistance $0.08 → $0.10
What to Watch Today
The critical near-term pivot for the entire crypto complex remains Bitcoin’s ability to sustain price above $62,000 and build toward a test of the $65,000 resistance zone — a break and close above that level would represent the most significant near-term bullish signal for both BTC and the broader altcoin market. Ethereum’s ability to close above $1,800 on a sustained basis will serve as the secondary confirmation signal for whether today’s marginal ETH outperformance is the beginning of a recovery in the ETH/BTC ratio or merely a single-session deviation. Broader macro sentiment — particularly any shifts in the interest rate outlook or risk appetite in traditional equity markets — remains the dominant exogenous variable capable of overriding crypto-specific technical patterns in either direction.
Data based on cryptocurrency market prices as of July 14, 2026, morning session. This article is for informational and educational purposes only and does not constitute financial advice.