

Market Snapshot
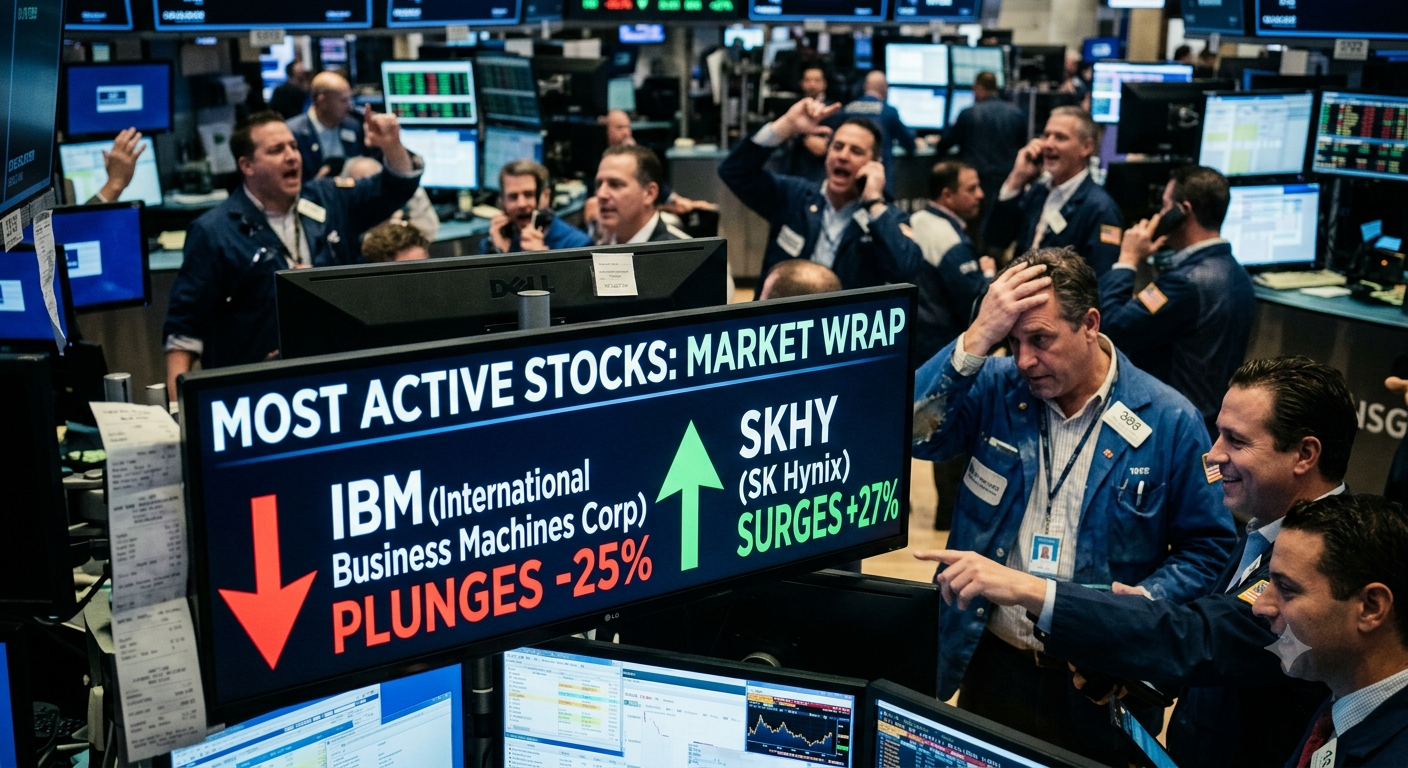
Semiconductor divergence and a historic single-session collapse in a legacy technology blue chip define Wednesday’s most active session, as SK hynix (SKHY) surges 27.29% on volume running near its three-month average while International Business Machines (IBM) plunges 25.21% on volume exceeding six times its average — marking one of the most severe single-session declines in a large-cap US name this year. Crypto-mining stocks present a bifurcated picture, with CleanSpark (CLSK) and Bitmine Immersion (BMNR) advancing while TeraWulf (WULF) and MARA Holdings (MARA) retreat. Broad market breadth leans modestly positive across the 25 most active names, though IBM’s collapse skews the narrative toward risk-off in the legacy technology space.
Today’s Most Active Stocks
- NU — Nu Holdings Ltd.: $13.99 (+2.34%) — Volume 152.75M vs Avg 58.61M — Trading at 2.6x average volume; P/E 21.09; positioned in the upper-middle of the 52-week range of $11.20–$18.98, suggesting room to either 52-week high resistance or a retest of mid-range support.
- AAL — American Airlines: $15.67 (−3.92%) — Volume 132.78M vs Avg 98.58M — Trading at 1.3x average volume; P/E 53.33; positioned in the upper-middle of the 52-week range of $10.09–$18.79, with the decline bringing the stock closer to mid-range territory.
- ONDS — Ondas Inc.: $7.36 (+5.75%) — Volume 108.47M vs Avg 72.28M — Trading at 1.5x average volume; P/E 15.91; positioned in the lower-middle of the 52-week range of $1.78–$15.28, well below 52-week highs despite the session gain.
- SKHYV — SK hynix Inc. (American Depositary Receipt): $168.01 (+0.00% per displayed data) — Volume 107.68M vs Avg 78.18M — The data display shows a dollar-change figure of +168.01 alongside a 0.00% percentage change, an anomaly consistent with a data feed presentation difference between share classes or ADR pricing; the percentage change of 0.00% is reported as displayed; P/E 18.29; positioned mid-range within the 52-week range of $151.30–$194.80.
- NVDA — NVIDIA Corporation: $211.80 (+4.06%) — Volume 101.97M vs Avg 157.66M — Trading at 0.6x average volume, below the three-month average despite a meaningful price advance; P/E 31.17; positioned in the mid-range of the 52-week band of $164.07–$236.54, with approximately $25 of room remaining to the 52-week high.
- OPEN — Opendoor Technologies: $4.55 (+1.45%) — Volume 95.62M vs Avg 50.06M — Trading at 1.9x average volume; no positive trailing earnings (P/E listed as —); positioned in the lower-middle of the 52-week range of $1.13–$10.87, indicating significant distance from both the 52-week low and the 52-week high.
- NOK — Nokia Oyj: $11.70 (+0.09%) — Volume 87.49M vs Avg 110.80M — Trading below average at 0.79x; P/E 76.29; positioned in the upper-middle of the 52-week range of $4.00–$17.45; the near-flat price change on below-average volume carries limited directional conviction.
- PATH — UiPath, Inc.: $11.94 (+0.76%) — Volume 85.81M vs Avg 45.76M — Trading at 1.9x average volume; P/E 19.60; positioned in the lower portion of the 52-week range of $9.20–$19.84, still closer to its annual low than its annual high.
- SOFI — SoFi Technologies: $18.55 (+2.32%) — Volume 83.69M vs Avg 76.45M — Trading at 1.1x average volume, roughly in line with the three-month mean; P/E 40.75; positioned in the lower-middle of the 52-week range of $14.92–$32.73, with the session gain insufficient to change its broader sub-range positioning.
- INTC — Intel Corporation: $107.76 (+4.50%) — Volume 81.31M vs Avg 134.39M — Trading at 0.6x average volume despite the price advance; no positive trailing earnings (P/E listed as —); the 52-week range of $18.97–$142.35 reflects an extraordinarily wide band consistent with a significant corporate restructuring event in the trailing twelve months; current price sits in the upper portion of that range.
- CLSK — CleanSpark, Inc.: $13.45 (+8.82%) — Volume 73.80M vs Avg 22.25M — Trading at 3.3x average volume, one of the most elevated volume readings relative to average on the list; no positive trailing earnings (P/E listed as —); positioned mid-range within the 52-week band of $8.00–$23.61.
- IBM — International Business Machines: $217.07 (−25.21%) — Volume 67.40M vs Avg 10.15M — Trading at 6.6x average volume, the single most extreme volume surge relative to average on the entire list; P/E 25.71; the collapse places IBM at the very low end of its 52-week range of $212.34–$332.46, trading marginally above the 52-week floor.
- SKHY — SK hynix Inc.: $193.92 (+27.29%) — Volume 66.62M vs Avg 78.76M — Trading near but slightly below the three-month average despite the exceptional price advance; P/E 18.29; positioned at the very top of the 52-week range of $151.30–$194.80, effectively at or near the 52-week high.
- WULF — TeraWulf Inc.: $19.41 (−7.08%) — Volume 58.00M vs Avg 31.48M — Trading at 1.8x average volume; no positive trailing earnings (P/E listed as —); positioned in the mid-range of the 52-week band of $4.64–$29.84, with significant distance to both extremes.
- MARA — MARA Holdings: $12.16 (−0.25%) — Volume 57.20M vs Avg 43.60M — Trading at 1.3x average volume; no positive trailing earnings (P/E listed as —); positioned in the lower-middle of the 52-week range of $6.66–$23.45, effectively flat on the session despite elevated volume.
- T — AT&T Inc.: $21.28 (−1.25%) — Volume 53.56M vs Avg 51.81M — Trading in line with the three-month average; P/E 7.20; positioned near the lower end of the 52-week range of $19.89–$29.79, with limited downside buffer to the 52-week floor.
- ORCL — Oracle Corporation: $127.94 (−2.74%) — Volume 52.62M vs Avg 29.80M — Trading at 1.8x average volume; P/E 22.56; the price sits at the very low end of the 52-week range of $127.60–$345.72, trading marginally above the 52-week low — a technically significant position for a large-cap enterprise software name.
- BMNR — Bitmine Immersion Technologies: $16.29 (+11.50%) — Volume 51.55M vs Avg 37.57M — Trading at 1.4x average volume; no positive trailing earnings (P/E listed as —); positioned in the lower portion of the 52-week range of $12.80–$71.74, still deep within the annual range despite the double-digit session gain.
- BAC — Bank of America: $60.62 (+1.88%) — Volume 49.43M vs Avg 35.59M — Trading at 1.4x average volume; no positive trailing P/E displayed (listed as —); positioned near the 52-week high of $61.21 within the annual range of $44.75–$61.21, with the current price approximately $0.59 from the 52-week ceiling.
- JOBY — Joby Aviation, Inc.: $7.89 (+5.48%) — Volume 49.05M vs Avg 35.93M — Trading at 1.4x average volume; no positive trailing earnings (P/E listed as —); positioned near the 52-week low of $7.43 within the range of $7.43–$20.95, with the session advance the only buffer between the current price and a new annual low.
- PLTR — Palantir Technologies: $133.72 (+2.83%) — Volume 45.35M vs Avg 43.23M — Trading at 1.0x average volume, essentially in line with the three-month mean; P/E 146.18; positioned in the lower-middle of the 52-week range of $106.37–$207.52.
- SPCX — Space Exploration Technologies (SpaceX) Class A: $136.08 (−2.20%) — Volume 45.05M vs Avg 138.75M — Trading at only 0.32x average volume, the most significantly below-average reading on the list; no positive trailing earnings (P/E listed as —); positioned near the 52-week low of $135.52 within the range of $135.52–$225.64.
- F — Ford Motor Company: $13.94 (+0.65%) — Volume 42.72M vs Avg 60.86M — Trading at 0.70x average volume; no positive trailing earnings (P/E listed as —); positioned mid-range within the 52-week band of $10.68–$17.78.
- BBD — Banco Bradesco: $3.63 (+0.55%) — Volume 42.62M vs Avg 31.19M — Trading at 1.4x average volume; P/E 8.54; positioned in the upper portion of the 52-week range of $2.73–$4.30, within approximately $0.67 of the 52-week high.
- PFE — Pfizer Inc.: $24.25 (−0.94%) — Volume 40.86M vs Avg 40.67M — Trading at 1.0x average volume, in line with the three-month mean; P/E 18.68; positioned in the lower-middle of the 52-week range of $23.11–$28.75, with limited downside buffer to the 52-week floor.
Top Gainers Analysis
SK hynix (SKHY): The Session’s Most Exceptional Advance
SK hynix Inc. (SKHY) posts the session’s largest percentage gain at +27.29%, advancing $41.57 to close at $193.92 — a price that places it effectively at the 52-week high within the annual range of $151.30–$194.80. An advance of this magnitude, representing more than a quarter of the company’s market value added in a single session on a name with a $1.377 trillion market capitalisation, is an exceptional single-session move consistent with major news flow — earnings, M&A activity, regulatory development, or a significant guidance update — though the specific catalyst was not confirmed in available data at the time of publication.
The 52-week range context amplifies the significance of the move. SK hynix had been trading mid-range through much of the preceding period; today’s advance has pushed the stock to within approximately $0.88 of the all-time high reading captured in the 52-week band, representing a technical breakout attempt. Volume of 66.62M against a three-month average of 78.76M is noteworthy: the fact that such a dramatic advance occurred on slightly below-average volume could indicate that sell-side supply was limited — a characteristic of moves driven by sudden information asymmetry rather than broad institutional repositioning. Whether the stock can hold above $190 in the coming sessions will be a key technical question.
The simultaneous appearance of SKHYV — the American Depositary Receipt for the same underlying Korean semiconductor — on the active list at $168.01 with a displayed 0.00% change and an anomalous dollar-change figure reflects a data presentation difference between the two share classes rather than a divergent price outcome. Readers following the SK hynix story should monitor both instruments but treat SKHY’s percentage move as the authoritative single-session performance read.
Bitmine Immersion Technologies (BMNR) and CleanSpark (CLSK): Crypto-Mining Gainers
Bitmine Immersion Technologies (BMNR) advances 11.50%, gaining $1.68 to $16.29, on volume of 51.55M against a three-month average of 37.57M — a 1.4x reading that confirms participation above the baseline. For a name with no positive trailing earnings and a 52-week range of $12.80–$71.74, today’s price positions BMNR in the lower portion of its annual band; the magnitude of the gain is consistent with a company-specific catalyst, though the specific driver was not confirmed in available data.
CleanSpark (CLSK) posts an 8.82% gain to $13.45, the more notable of the two crypto-mining advances from a volume conviction standpoint. The 73.80M shares traded against a three-month average of just 22.25M represents 3.3x normal activity — the highest volume-to-average ratio among the gainers on the list. That combination of elevated volume and meaningful price advance typically signals confirmed institutional participation rather than retail-driven momentum. CLSK also carries no positive trailing earnings, consistent with the capital-intensive, growth-phase nature of industrial bitcoin mining operations. The stock remains in the mid-range of its $8.00–$23.61 annual band.
Ondas Inc. (ONDS), Joby Aviation (JOBY), and SoFi Technologies (SOFI)
Ondas Inc. (ONDS) advances 5.75% on volume 1.5x its three-month average, reaching $7.36 within the lower-middle of its $1.78–$15.28 annual range. JOBY Aviation gains 5.48% to $7.89 on 1.4x average volume, a session advance that provides a thin buffer above the 52-week low of $7.43 — technically, JOBY’s current price means the stock is within $0.46 of setting a new annual low, making the volume-confirmed upside session a constructive data point worth monitoring. SoFi Technologies (SOFI) advances 2.32% to $18.55 on volume in line with its three-month average, a modest gain in a name that remains positioned in the lower-middle of its $14.92–$32.73 annual range.
Nu Holdings (NU) and NVIDIA (NVDA): Large-Cap Gainers
Nu Holdings (NU) leads the most active list by total trading volume at 152.75M shares — 2.6x its three-month average of 58.61M — advancing 2.34% to $13.99. The elevated volume on a modestly positive session represents the largest absolute volume reading of the day and merits attention as a potential signal of institutional accumulation in the Brazilian fintech name, though the relatively contained price advance limits the directional conviction read. NVIDIA (NVDA) gains 4.06% to $211.80 on volume of 101.97M, notably below its three-month average of 157.66M. The below-average volume on a positive session for the world’s most widely traded large-cap semiconductor name is atypical, potentially indicating that the move reflects broader index flows rather than NVDA-specific conviction buying.
Top Losers Analysis
IBM: A Blue-Chip Collapse
International Business Machines (IBM) records the session’s most severe absolute decline, falling 25.21% — a loss of $73.16 per share — to close at $217.07 on volume of 67.40M shares against a three-month average of just 10.15M. That volume reading represents 6.6x the baseline, the single most extreme volume-to-average surge on the entire 25-name list. The combination — a quarter of market value erased in a single session on volume nearly seven times the mean — is consistent with a severe company-specific event: a major earnings miss, a guidance collapse, litigation outcome, accounting disclosure, or similar material development. The specific catalyst was not confirmed in available data at the time of publication.
The 52-week range context is stark. IBM’s annual range of $212.34–$332.46 places the current price of $217.07 within $4.73 of the 52-week low — effectively at the floor of the trailing twelve-month trading band for one of the oldest and most widely held US technology companies. Whether $212.34 holds as support will be a defining technical question heading into the next session. A break below the 52-week low on continued elevated volume would represent a significant structural deterioration for the name. The magnitude of the move and volume profile are not consistent with a normal day’s selling; this session carries the hallmarks of a forced repositioning event across the IBM shareholder base.
American Airlines (AAL), Oracle (ORCL), and TeraWulf (WULF)
American Airlines (AAL) declines 3.92% to $15.67 on volume of 132.78M, 1.3x its three-month average. The weakness appears isolated to the airline rather than sector-wide given the absence of other carriers on the active list. With a P/E of 53.33 and a price positioned in the upper-middle of the $10.09–$18.79 annual range, AAL’s decline brings the stock toward the mid-point of its annual band. Oracle (ORCL) falls 2.74% to $127.94 on volume 1.8x its three-month average — and critically, the price sits at $127.94, just $0.34 above the 52-week low of $127.60. Oracle trading near a 52-week low within a $127.60–$345.72 annual band represents a technically significant level for a $368.5 billion enterprise software company; high-volume selling near an annual floor raises the question of whether support holds or distribution continues. TeraWulf (WULF) declines 7.08% on 1.8x average volume, a meaningful loss in the crypto-mining space that contrasts with CLSK and BMNR’s gains on the same session, suggesting stock-specific rather than sector-wide pressure within digital asset infrastructure names.
Sector and Theme Read
Semiconductors: A Tale of Two Stories
The semiconductor complex is the most consequential theme of the session, and it is not a uniform story. SK hynix (SKHY) posting a 27.29% single-session gain while simultaneously appearing via its ADR (SKHYV) on the volume list establishes the Korean memory chip maker as the session’s defining equity event. NVIDIA (NVDA) adds 4.06% but on below-average volume — a divergence from typical NVDA high-conviction days. Intel (INTC) gains 4.50% to $107.76 but also on below-average volume (0.6x the mean), within a 52-week range of $18.97–$142.35 that reflects the extraordinary price history of a company that has undergone substantial structural change over the trailing year.
The semiconductor read for the session is bullish in terms of price direction but mixed in terms of conviction. SKHY’s move is an outlier that likely reflects company-specific news rather than a broad memory chip re-rating. NVDA and INTC’s below-average volume advances suggest the broader chip space is not seeing the kind of institutional surge that would signal a sector rotation event. Still, three semiconductor-adjacent names in the top ten most active slots — all finishing positive — represents a constructive tone for the space.
Crypto-Mining Infrastructure: Bifurcated Session
Four bitcoin mining and digital asset infrastructure names appear in the most active list: CleanSpark (CLSK), TeraWulf (WULF), MARA Holdings (MARA), and Bitmine Immersion (BMNR). The session split is two-and-two: CLSK and BMNR advance while WULF retreats 7.08% and MARA is essentially flat (−0.25%). None of the four carry positive trailing earnings, consistent with the capital-expenditure-heavy, pre-profitability phase that characterises most publicly listed bitcoin miners.
The divergence within the group suggests stock-specific factors are driving individual names rather than a uniform sector catalyst. CLSK’s 3.3x volume surge is the most notable data point — when one name in a correlated group runs on outsized volume while peers diverge, the elevated-volume name is typically experiencing a company-specific development. The overall crypto-mining basket tone is neutral-to-slightly-positive on this session, with no clear unifying directional signal.
Fintech and Neobank Names: Constructive
Nu Holdings (NU) and SoFi Technologies (SOFI) both advance, and NU leads the entire most active list in raw volume at 152.75M shares. Both names carry elevated P/E ratios (NU at 21.09, SOFI at 40.75) reflecting growth-premium valuations. The session is modestly constructive for the fintech theme, with above-average volume on NU providing the most actionable signal — institutional-scale activity in a $67.6 billion market cap neobank on a positive price day merits monitoring for follow-through.
Legacy Technology: IBM’s Disruption
IBM’s 25.21% collapse dominates the legacy technology narrative and effectively defines the session’s headline risk-off event. Oracle (ORCL) is also under pressure, falling 2.74% to touch near its 52-week low at $127.94. The two legacy enterprise technology names — IBM and Oracle — are both under meaningful selling pressure, though IBM’s move is categorically more severe and volume-confirmed. The co-appearance of both names in the most active losers group raises the question of whether there is a shared thematic pressure in the legacy enterprise software and services space, or whether IBM’s move is entirely idiosyncratic. Available data does not confirm a shared catalyst; the ORCL decline, while notable given its proximity to a 52-week low, is within the range of normal trading activity for the name.
Airlines and Telecom: Sector-Isolated Weakness
American Airlines (AAL) is the sole airline on the list and declines 3.92%. AT&T (T) falls 1.25% on volume in line with its average, positioned near the lower end of its $19.89–$29.79 annual range. Neither move signals a broad sector crisis — each is consistent with stock-specific or macro-rate-sensitivity factors. AT&T’s consistent proximity to its 52-week low across recent sessions remains a structural observation for the telecom name.
Emerging and Speculative Names: Joby, Palantir, SpaceX
Joby Aviation (JOBY) gains 5.48% but from a position just above its 52-week low, keeping the eVTOL name in technically fragile territory. Palantir (PLTR) advances 2.83% on volume essentially in line with its average, with a P/E of 146.18 that reflects the market’s extreme growth premium for the data-analytics and AI-government-contract name. SpaceX (SPCX) declines 2.20% on dramatically below-average volume — 0.32x the mean — with the price touching near the 52-week low of $135.52 at $136.08. The low-volume nature of SPCX’s move near an annual floor is the combination that carries the least confirmatory information: it is neither a capitulation (which would require high volume) nor a volume-confirmed break.
Volume Anomalies
The session produces several standout volume anomalies that merit explicit treatment beyond the standard listing commentary:
IBM (6.6x average volume, −25.21%): High volume combined with extreme price decline is the clearest possible signal of confirmed, institutional-scale distribution. When a $204 billion company trades at nearly seven times its daily average on a 25% down session, the market is not experiencing a temporary dislocation — it is undergoing a forced repricing event with broad shareholder participation. This volume profile is consistent with index rebalancing, fund liquidation, and stop-loss cascades simultaneously.
CLSK (3.3x average volume, +8.82%): High volume combined with a meaningful price advance signals confirmed buying interest. The 3.3x reading is the second most extreme volume-to-average ratio on the gainers side of the list. For a small-cap name with a $3.5 billion market cap and no positive trailing earnings, this combination is the type of data point that precedes further analysis into what is driving the session’s interest.
NU (2.6x average volume, +2.34%): Elevated volume on a modestly positive session for the session’s most active name by raw shares traded. The price advance is contained relative to the volume surge, which could indicate one of two things: supply met demand at current levels (price resistance), or a very large number of participants traded the name with no directional consensus. Further sessions will clarify whether today’s volume represents accumulation or distribution.
SPCX (0.32x average volume, −2.20%): The most significantly below-average volume reading on the list. A decline near the 52-week low on less than one-third of the average daily volume carries limited directional conviction — this type of move can represent a low-participation drift toward support rather than an active distribution event. A follow-on session at high volume to the downside would be a more definitive signal.
NVDA and INTC (both approximately 0.6x average volume on positive sessions): Two of the session’s most widely followed semiconductor names both advance on below-average volume. This pattern — positive price on low relative volume — carries the risk of reversal given the absence of institutional conviction behind the move. Neither session qualifies as a high-conviction breakout.
OPEN (1.9x average volume, +1.45%) and PATH (1.9x average volume, +0.76%): Both Opendoor Technologies and UiPath trade at nearly double their average volumes on modest positive sessions. The elevated activity relative to the subdued price advances may reflect positioning activity — sector or factor rotation — rather than directional conviction in either name specifically.
52-Week Range Context
Several names on the most active list occupy technically significant positions at the extremes of their annual trading ranges, and the volume context attached to each extreme carries analytical weight. SK hynix (SKHY) at $193.92 against a 52-week high of $194.80 is effectively at its annual ceiling — a position that typically sets up one of two outcomes: a volume-confirmed breakout above resistance or a rejection from the high that draws profit-taking. Today’s below-average volume on such an extreme advance is an unusual combination and raises the question of whether sufficient institutional firepower exists to sustain the name above the 52-week high in subsequent sessions.
At the opposite end of the spectrum, IBM at $217.07 against a 52-week low of $212.34 places one of the most widely held US technology stocks within $4.73 of its annual floor following a collapse of historic proportions for a blue-chip name. Oracle (ORCL) at $127.94 against a 52-week low of $127.60 — a margin of just $0.34 — places the enterprise software giant in similarly precarious technical territory. The co-existence of IBM and Oracle near 52-week lows on an above-average volume session is the most strategically significant technical observation of the day for the legacy technology sector. Names near 52-week lows on elevated volume are typically at a decision point: either the volume represents capitulation selling that exhausts supply and sets up a recovery, or it represents the early stages of a structural breakdown below annual support. AT&T (T) and SpaceX (SPCX) also appear near the lower end of their annual ranges, though on less extreme volume readings. Bank of America (BAC), by contrast, is the most constructive 52-week range story among the session’s major names — at $60.62 within $0.59 of its 52-week high of $61.21, BAC’s positive close on above-average volume signals potential breakout territory for the large-cap US bank.
What to Watch
IBM (IBM) is the name requiring the most urgent monitoring into the next session: a price of $217.07 within $4.73 of the 52-week low following a 25.21% decline on 6.6x average volume means the stock is one moderate session of selling away from breaking below its annual floor — a technically and psychologically significant event for a $204 billion Dow Jones component. Oracle (ORCL) at $127.94, $0.34 above its own 52-week low on elevated volume, deserves parallel attention for the same structural reason: annual support in a large-cap enterprise technology name tested on above-average volume is either the setup for a bounce or the precursor to a range break. SK hynix (SKHY) at $193.92 — effectively at the 52-week high of $194.80 — will signal whether today’s exceptional gain represents a genuine re-rating with follow-through buying or a single-session event that exhausts buying interest at the annual ceiling, with the first post-event session’s volume and price action providing the critical data point.
Data based on most active stocks by trading volume as of July 15, 2026. This article is for informational and educational purposes only and does not constitute financial advice.