

Gold trades cautiously bullish at $4,458 after a sharp intraday sell-off driven by stronger-than-expected US labour market data, with the metal now testing a critical technical shelf where the next directional move will be determined. The sell-off is treated as a potential buy-the-dip setup within the broader uptrend, provided support structure holds through the New York afternoon session. A confirmed bounce above $4,468 restores the bull case; a sustained break below $4,440 shifts the day’s bias to neutral.
Key Levels
- Bias: Bullish above $4,468 | Neutral below $4,440
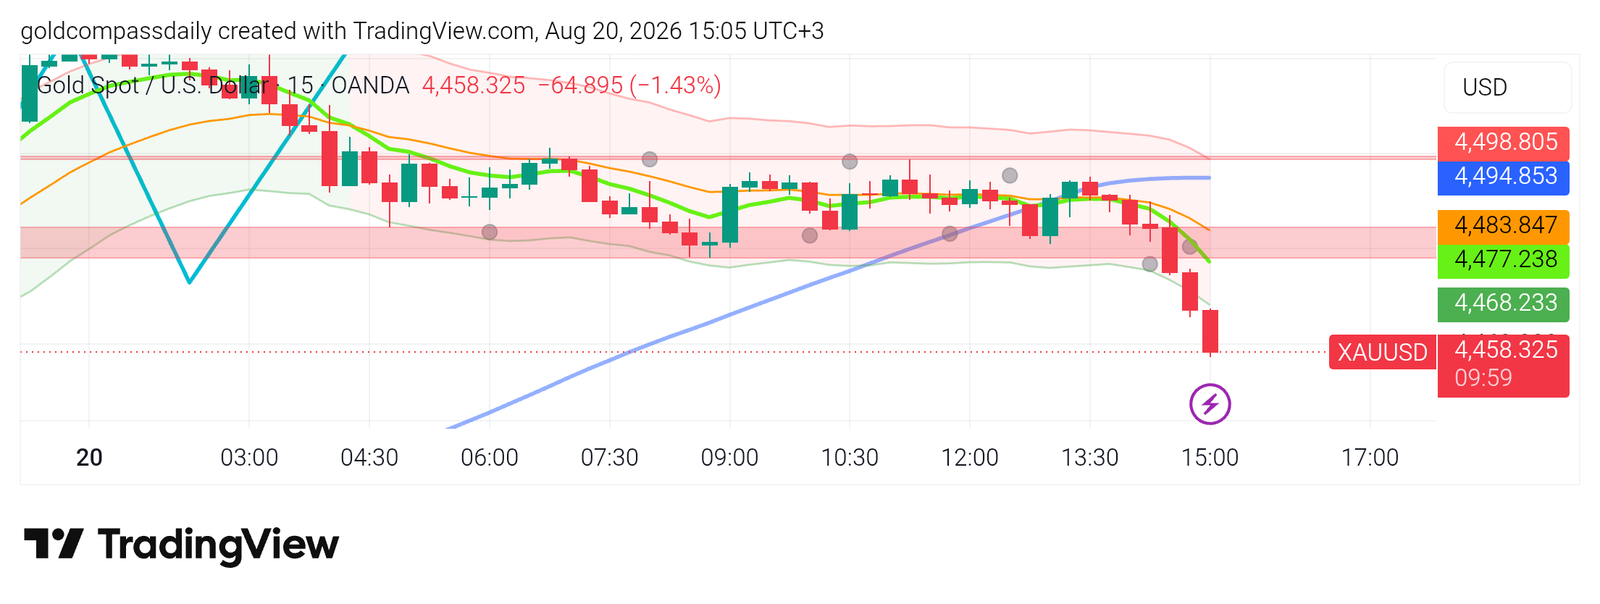
- Support: $4,458 (current) → $4,440 → $4,420 (dotted shelf)
- Resistance: $4,468 (green MA) → $4,484 (orange MA) → $4,499 (session high / hard resistance)
- Session target: $4,484–$4,499 (conditional on reclaim of $4,468 and soft CB Leading Index)
- Invalidation: Below $4,420 = intraday bull structure broken, deeper retracement to $4,390–$4,400 opens
Catalyst of the Day
The dominant catalyst for Thursday’s New York session is the US Unemployment Claims print and the Philadelphia Fed Manufacturing Index, both released at 12:30pm ET. The sharp drop visible on the 15-minute chart from 14:45 UTC+3 coincides precisely with this data window, suggesting the market read incoming figures as dollar-supportive — compressing gold’s risk premium. The CB Leading Index at 2:00pm ET is the follow-up event to monitor: a soft print would reverse the dollar bid and give gold a window to recover toward $4,484. Gold Compass Daily will update levels following the Leading Index release.
Fundamental Context
The macro backdrop remains structurally supportive for gold even as today’s session introduces short-term friction. Australian employment came in at -15.8K against expectations, with the unemployment rate rising to 4.5% — a global labour market softening signal that reinforces the case for central bank easing cycles. Softening employment trends globally reduce real yield expectations over the medium term, which historically expands gold’s non-yielding asset premium. While the Australian data does not move gold directly, it adds to the broader narrative of decelerating labour markets that has underpinned bullion’s 2026 advance.
German PPI came in at +1.1% month-on-month for August, a stronger-than-anticipated print that briefly supported EUR/USD but did not materially shift gold’s European session trajectory. Elevated producer prices in Germany reflect residual cost pressures in the eurozone supply chain, which feed into inflation expectations — a secondary tailwind for gold as a real-asset hedge. China’s 1-year Loan Prime Rate held at 3.00% and the 5-year LPR at 3.50%, confirming the People’s Bank of China remains in a measured easing posture. Chinese rate stability reduces immediate stimulus impulse expectations, but the direction of travel — toward accommodation — keeps physical demand expectations constructive for gold over coming months. Gold Compass Daily’s weekly hub for August 17–22 identified the $4,420–$4,500 range as the key battleground for the week, and today’s price action confirms that assessment remains operative.
Chart Analysis
The XAU/USD 15-minute chart as of 15:05 UTC+3 shows a sharp deterioration from the session high of $4,498.80, with price collapsing through three moving average layers in rapid succession. The green short-term MA (~$4,468) and the orange mid-term MA (~$4,484) have both flipped to overhead resistance following the breakout candle at approximately 14:45 UTC+3, which coincides with the US data catalyst. Current price at $4,458.33 is trading below all three MAs, but notably above the rising blue long-period MA (~$4,455–$4,460 zone), which provides dynamic support and is the structural line in the sand for the bull case. A Bollinger Band compression through the mid-session hours (07:00–13:30 UTC+3) preceded the breakdown — a classic volatility squeeze resolved to the downside. The dotted red horizontal line near $4,420–$4,425 marks the next significant structural support level on this timeframe. The immediate recovery scenario requires price to reclaim the green MA at $4,468 and close a 15-minute candle above it; absent that, the path of least resistance points toward $4,440 first, then the $4,420 shelf.
Bull / Bear Scenarios
Bull Scenario
Trigger: Price reclaims and holds above $4,468 (green MA) on a 15-minute close, supported by a soft CB Leading Index reading at 2:00pm ET.
Target: Initial move to $4,484 (orange MA), extension to $4,499 session high. Full bull resumption above $4,499 targets the $4,510–$4,520 zone not yet tested on this chart.
Bear Scenario
Trigger: Failure to reclaim $4,468 within the next two hours, with a confirmed break and close below $4,440.
Target: Retracement to the structural support shelf at $4,420–$4,425. A sustained break of $4,420 opens a deeper corrective leg toward $4,390–$4,400, where Gold Compass Daily’s prior session analysis identified the broader consolidation base.
Events Ahead
- Thu Aug 20, 2:00pm ET — CB Leading Index m/m: A soft or negative print reduces growth expectations and dollar demand, giving gold a potential recovery catalyst.
- Thu Aug 20, 2:30pm ET — Natural Gas Storage: Secondary; indirect energy-inflation read, low direct impact on gold.
- Thu Aug 20, 11:30pm ET — Japan National Core CPI y/y: A hot print strengthens JPY, typically a mild headwind for USD-denominated gold; watch for BOJ policy implications.
- Fri Aug 21, 11:00pm ET — Australia Flash Manufacturing & Services PMI: Global growth pulse; weak PMIs amplify safe-haven demand for gold into the weekend.
New York Session Update
Price Check
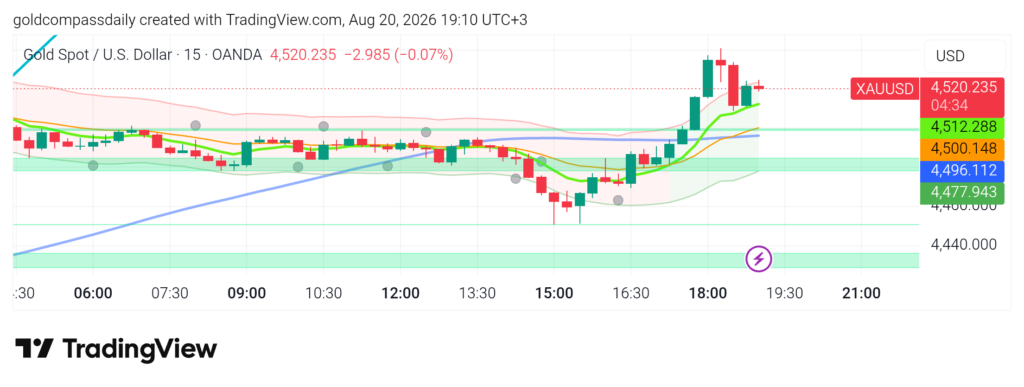
Gold Compass Daily’s morning analysis flagged $4,468 as the line in the sand for the bull case — price has not only reclaimed that level but has extended 62 points above it, trading at $4,520.24 as of 19:10 UTC+3. The morning buy thesis has validated in full, with the $4,458 low confirmed as the session floor.
What Changed
The catalyst that drove the morning sell-off reversed sharply through the New York afternoon session. Price found structural support at the $4,458–$4,460 zone — precisely the green horizontal band visible on the 15-minute chart — and staged an aggressive recovery beginning near 15:00 UTC+3, reaching an intraday high of approximately $4,535–$4,540 before pulling back to current consolidation levels. The CB Leading Index data released at 2:00pm ET appears to have been the pivotal reversal trigger, consistent with the morning analysis’s conditional: a soft Leading Index print would reduce growth expectations, remove the dollar bid, and open a recovery window for gold. All three moving averages have since rotated higher and are now stacked in bull alignment beneath price, confirming the shift in short-term momentum from breakdown to breakout.
Updated Levels
- Current price: $4,520.24
- Bias now: Bullish — confirmed, elevated from cautious to active following reclaim of all MA layers
- Updated support: $4,500 (orange MA) → $4,478 (green MA, rising) → $4,458–$4,460 (session floor / structural shelf)
- Updated resistance: $4,530–$4,535 (dotted red ceiling, tested and holding) → $4,540 (session high) → $4,550+ (uncharted extension)
- NY session target: $4,535–$4,540 on a clean break and close above the dotted resistance line; $4,550 on continuation into the close
Scenarios Into the Close
Bull: A 15-minute close above $4,535 with the green and orange MAs holding as support confirms momentum continuation — target $4,550 into the NY close.
Bear: Failure to hold $4,500 (orange MA) on any pullback shifts the session to consolidation mode — renewed pressure below $4,478 reopens the $4,458 floor test.
Chart Analysis
The XAU/USD 15-minute chart as of 19:10 UTC+3 presents a textbook V-shaped recovery structure. The session low at approximately $4,458–$4,460 — formed at the 15:00 UTC+3 data catalyst — held precisely at the broad green support band that spans the $4,440–$4,460 zone, which had been flagged in Gold Compass Daily’s morning analysis as the structural invalidation shelf. From that low, price accelerated aggressively through the green MA ($4,477.94), orange MA ($4,500.15), and blue long-period MA ($4,496.11) in rapid succession, confirming a momentum shift rather than a technical bounce. All three MAs are now rising and positioned below current price in bull sequence. The primary overhead barrier is the dotted red resistance line near $4,530–$4,535, which price tested during the 18:00–18:30 UTC+3 spike and has since pulled back from — current consolidation around $4,520 suggests a brief pause before the next directional attempt. A sustained break above $4,535 on volume would open a clean extension toward $4,550 and beyond; the absence of significant technical resistance above that level on this timeframe supports the bull continuation case heading into the NY close.
New York Close & Asian Session Outlook
NY Close
Gold closed the New York session at approximately $4,521.88 — bullish — with the morning buy thesis confirmed in full after price recovered from the $4,458 intraday low to close within striking distance of the session high. The day’s range of roughly $77 (low $4,458 to high $4,536) resolved in favour of buyers, validating Gold Compass Daily’s morning analysis which identified $4,468 as the bull/bear line and projected a recovery toward $4,499–$4,535 on a soft CB Leading Index print.
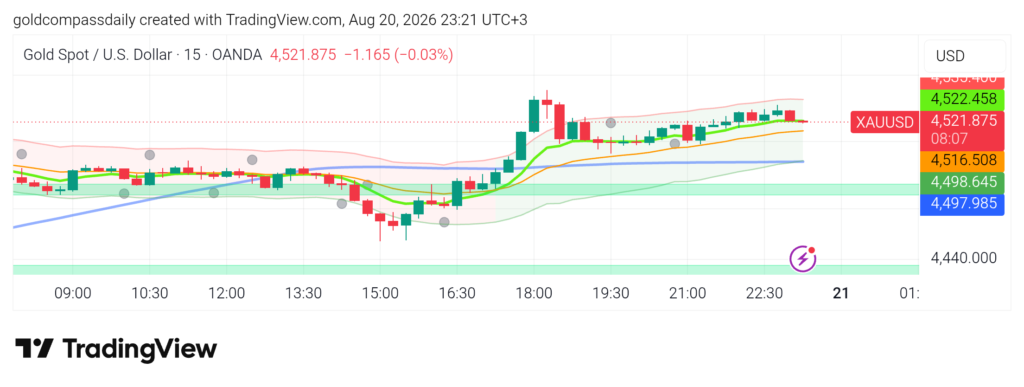
Chart Read at Close
The 15-minute chart at 23:21 UTC+3 shows price coiling directly beneath the dotted red resistance line at $4,522–$4,525 following a Bollinger Band expansion during the 18:00 UTC+3 spike and a subsequent sharp contraction through the late New York hours. The green and orange MAs have converged tightly around current price — a configuration that historically precedes a volatility expansion rather than a sustained grind. The blue long-period MA continues to rise from the $4,498 zone, maintaining structural support well below current price. Closing candle bodies through 21:00–23:21 UTC+3 are small and alternating, indicating balanced order flow at this level rather than directional conviction. The late-session lightning bolt near 23:00 UTC+3 corresponds to Japan’s National Core CPI release, which appears not to have materially disrupted the established range — price held its level, which is a mild bull signal into the Asian open.
Asian Session Outlook
The Asian session (00:00–09:00 UTC+3) is most likely to be range-bound to mildly bullish, with price oscillating between the dotted red ceiling at $4,522–$4,525 and the orange MA at $4,516. A liquidity sweep of the NY session high at $4,535–$4,536 is the primary upside risk event — thin Asian liquidity can accelerate such moves quickly. The more probable scenario is a sideways consolidation that builds the base for a directional break during early London. A dip toward $4,498–$4,500 should be treated as a buy-the-dip opportunity within the intact bull structure unless that level fails on a closing basis.
Next Day Bull / Bear Scenarios
Bull trigger: Clean break and 15-minute close above $4,525 during London open — target $4,535–$4,536 initially, extension to $4,550 on continuation.
Bear trigger: Sustained break below $4,498 (blue MA / secondary shelf) with a closing candle beneath it — retracement to $4,477–$4,480, with $4,458 as the deeper structural test.
Tomorrow’s Key Events
- 02:00 UTC+3 (overnight) — Australia Flash Manufacturing & Services PMI: Weak PMIs add to global growth slowdown narrative, supporting safe-haven gold demand into the London open.
- 03:01 UTC+3 — GBP GfK Consumer Confidence: Secondary; directional impact on sterling more than gold, but contributes to broader risk sentiment read.
- 02:30 UTC+3 (overnight) — Japan National Core CPI y/y: Already released at 23:30 UTC+3 Aug 20 — monitor for delayed BOJ policy reaction in early Asian price action.
- No major US data Friday — lower liquidity conditions may amplify any technical breakout above $4,525 or breakdown below $4,498.
Analysis based on the XAU/USD 15-minute chart as of August 20, 2026, 15:05 UTC+3. This article is for informational and educational purposes only and does not constitute financial advice.