

Gold trades cautiously bullish at $4,434 — consolidating above a key demand zone following a sharp three-day selloff driven by Fed Chair Warsh’s hawkish Jackson Hole signal. Today’s ISM Manufacturing PMI and JOLTS Job Openings data are the decisive data catalysts: a soft print reopens the path to $4,464–$4,472, while a hot read risks a retest of $4,400 support.
Key Levels
- Bias: Cautiously Bullish above $4,420; Bearish below $4,400
- Support: $4,420 → $4,400 (demand base and structural low)
- Resistance: $4,455–$4,464 (consolidation ceiling) → $4,472 (session projected target) → $4,500 (200-day SMA, macro pivot)
- Session target: $4,472 (conditional on ISM Manufacturing below 55.0 and JOLTS below 7.33M)
- Invalidation: Close below $4,400 = bearish continuation toward $4,370 (100-day SMA)
Catalyst of the Day
The single most important catalyst for Tuesday’s session is the dual release of ISM Manufacturing PMI (forecast: 55.2) and JOLTS Job Openings (forecast: 7.33M) at 5:00 PM London / 12:00 PM New York. These two prints carry maximum weight this week because they are the first hard US data points released since Fed Chair Kevin Warsh’s hawkish Jackson Hole speech reset the market’s rate-path expectations. Markets are now pricing a 65% probability of a September hike at the September 15–16 FOMC meeting — a level that makes gold acutely sensitive to any data that confirms or undermines that trajectory. A strong ISM print above 55.6 (the prior) alongside JOLTS above 7.36M would reinforce the hike-is-coming narrative, tightening the ceiling on gold. A softer-than-expected double miss — ISM below 54.5 and JOLTS below 7.0M — would provide the first concrete justification for markets to reduce September hike bets and could unlock a relief rally for gold toward $4,472. Watch the ISM Prices Paid sub-component (forecast: 70.5) with equal attention: a reading above 71 keeps the inflation story alive and limits gold’s upside even if the headline PMI disappoints. The FOMC Member Barr speech at 4:05 PM London precedes the data and may set intraday tone.
Fundamental Context
Fed Chair Kevin Warsh’s debut Jackson Hole address on Friday, August 28 delivered the most consequential macro shock for gold in weeks. Warsh stated the Fed “must be confident that underlying inflation is moving to our objective, clearly and at sufficient speed — otherwise, we have work to do.” The statement was immediately interpreted by markets as a hawkish policy signal, driving futures-implied September hike odds from approximately 40% before the speech to 65% by Tuesday morning. For gold — a non-yielding asset — higher rate expectations are structurally bearish because they lift the opportunity cost of holding the metal and typically support a stronger US Dollar. The two-year Treasury yield surged 11–12 basis points on Friday and remains elevated near 4.325%, acting as a direct headwind for gold’s recovery.
Compounding the Fed repricing is the renewed escalation of US–Iran military tensions in the Strait of Hormuz. A US military strike on Iranian rocket launchers on Larak Island on Sunday was met with IRGC retaliatory fire against US bases in the region. The exchange sent oil prices sharply higher, which in turn reinforces fears of persistent inflation — feeding directly into the hawkish Fed narrative. For gold, the geopolitical dimension creates a countervailing force: safe-haven demand supports a floor, but if oil-driven inflation is the driver, markets increasingly view gold as a rate-risk vehicle rather than a simple haven. The net effect keeps gold trapped in a compression zone rather than generating a directional breakout. The broader macro picture shows gold on track to close August with gains exceeding 9%, reinforcing that the longer-term structural bid — anchored in real-yield dynamics, central bank accumulation, and US debt concerns — remains intact, even as near-term price action is data-dependent.
Chart Analysis (15-Minute, Sep 1 2026)
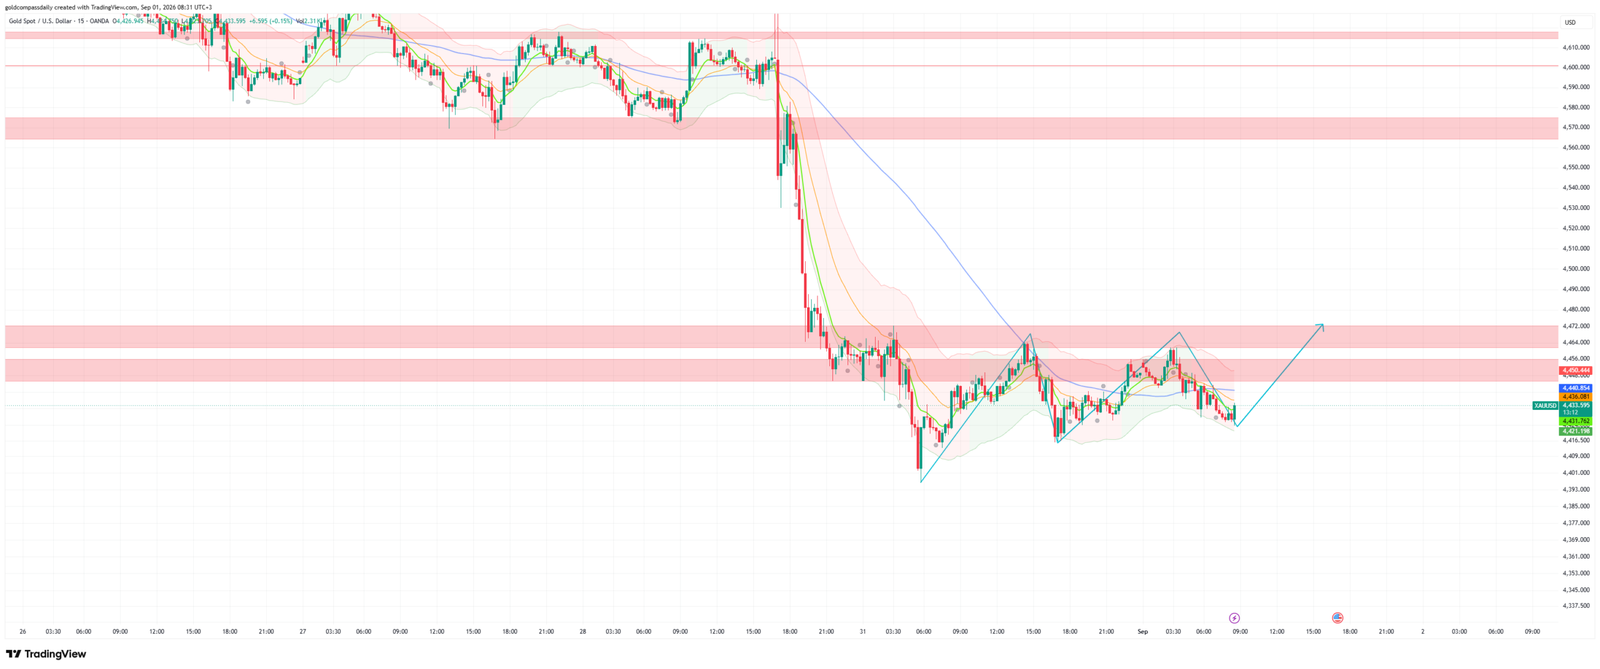
The 15-minute XAU/USD chart presents a market in post-selloff consolidation. Price dropped sharply from the $4,580–$4,610 resistance zone visible on the left of the chart, accelerating into a near-vertical decline through August 31 that found a structural low around $4,400. Since that low, price has been constructing a series of higher lows in a wedge or ascending triangle pattern between $4,420 support and the $4,455–$4,464 resistance ceiling. The chart’s annotated projected path — a blue diagonal line — shows the analyst’s roadmap: a final test of the $4,420 demand base followed by a recovery extension toward $4,472. The moving averages on the chart are stacked bearishly in the short term (the faster EMAs remain below the slower SMA), but are beginning to converge and flatten, consistent with consolidation rather than continuation of the downtrend. The wide Bollinger Band spread has narrowed materially from the peak-volatility selloff phase, signaling a volatility contraction that typically precedes a directional resolution. The key structural imbalance (fair value gap) from the sharp drop between $4,464 and $4,540 remains unfilled — a technical magnet for price if bullish momentum returns. No immediate bearish structural break is evident within the current session range, supporting the cautious buy bias, with the key trigger being a sustained hold above $4,420 into the US data window.
Bull / Bear Scenarios
Bull Scenario
Trigger: ISM Manufacturing PMI prints below 55.0 and/or JOLTS below 7.0M, reducing September hike probability below 55%. Gold holds above $4,420 into the data release and breaks above $4,455 on the print. Target: $4,472 (session high target), followed by $4,500 (200-day SMA, macro resistance). This scenario confirms the consolidation base held and opens the first leg of a recovery from the Jackson Hole drawdown. A clean daily close above $4,500 would shift the near-term structure from corrective to bullish resumption.
Bear Scenario
Trigger: ISM Manufacturing PMI prints above 55.6 (prior) and ISM Prices Paid exceeds 71.0, reinforcing the September hike narrative and pushing the two-year Treasury yield back above 4.40%. Gold breaks below $4,420 on volume. Target: $4,400 (structural base), followed by $4,370 (100-day SMA). A confirmed daily close below $4,400 shifts near-term bias firmly bearish and opens the risk of a deeper retracement toward $4,315 — the estimated pivot identified by institutional forecasters for this correction phase.
Events Ahead This Week
- Tue Sep 1, 5:00 PM London — ISM Manufacturing PMI (forecast: 55.2) + ISM Prices Paid (forecast: 70.5): Primary catalyst today; an above-consensus Prices Paid print confirms sticky inflation, extending gold’s ceiling.
- Tue Sep 1, 5:00 PM London — JOLTS Job Openings (forecast: 7.33M): Tight labor market data would reinforce the Fed’s case to hike, weighing on gold through the rate-hike channel.
- Tue Sep 1, 12:00 PM London — Eurozone CPI Flash Estimate y/y (forecast: 3.3%): A hot European inflation print lifts global rate expectations and indirectly pressures gold through USD and yield dynamics.
- Tue Sep 1, 4:05 PM London — FOMC Member Barr Speaks: Any forward guidance on September policy will set intraday tone ahead of the data releases.
- Wed Sep 2 — ADP Employment Change: Second major jobs signal before Friday’s NFP; a strong print above 200K firms September hike odds above 70%, a negative for gold.
- Thu Sep 3 — ISM Services PMI + Initial Jobless Claims: Services inflation and labor market health — two of Warsh’s stated inflation watch variables.
- Fri Sep 4 — August Nonfarm Payrolls + Unemployment Rate: The week’s definitive catalyst; a strong payrolls print above 200K would likely lock in the September hike and deliver the next material leg down for gold. A miss opens the door to a full reversal of the post-Jackson Hole drawdown.
For broader context on the macro setup driving this week’s price action, see Gold Compass Daily’s Week Ahead: Jackson Hole and the ATH Setup. For yesterday’s full session breakdown including the Warsh shock and Iran strike analysis, see XAU/USD at $4,433 — Warsh Shock and Iran Strikes Weigh on Gold.
London Session Update
Price Check
Gold has broken materially lower since the morning session, trading at $4,383 at the time of this update — down approximately $50 from the $4,434 level identified in the morning analysis. The morning’s cautiously bullish thesis, contingent on price holding above $4,420, has been invalidated by a decisive break through that level during the London session.
What Changed
The primary driver of the London-session breakdown was the Eurozone CPI Flash Estimate, which printed above consensus at 3.3% y/y against a prior of 2.9% — a materially hot inflation read that reinforced the global rate-tightening narrative rather than softening it. That data, combined with a broadly firm US Dollar and continued pressure from elevated Treasury yields following Warsh’s Jackson Hole signal, removed the cushion that was holding gold above $4,420. Price sliced through the morning’s stated invalidation level of $4,400 with momentum, accelerating to a session low near $4,360 before staging a partial recovery bounce to current levels around $4,383. The bounce has so far been tentative — the market is searching for a credible support base ahead of the New York handoff and the pivotal ISM Manufacturing and JOLTS releases. European PMI prints came in broadly in line with forecasts and offered no offsetting catalyst. The DXY has remained supported, capping any gold recovery attempt from below.
Updated Levels
- Current price: $4,383
- Bias now: Bearish — morning invalidation level ($4,400) broken with conviction; bias has shifted from cautiously bullish to bearish until price reclaims $4,400 on a closing basis
- Updated support: $4,360 (session low, intraday structural base) → $4,340 (next downside extension zone)
- Updated resistance: $4,397 (200-period EMA, current overhead) → $4,415 (fast EMA cluster) → $4,430 (prior demand, now resistance)
- London session target: $4,360 retest on continued selling pressure, or $4,415 on ISM/JOLTS data miss
Scenarios into the NY Handoff
Bull: ISM Manufacturing prints below 54.5 and JOLTS comes in below 7.0M — September hike odds compress, gold reclaims $4,397 and targets $4,415–$4,430 into the close. Bear: ISM Prices Paid above 71.0 and JOLTS above 7.36M lock in September hike expectations — gold loses $4,360 and the next structural level is $4,340, opening a deeper corrective leg.
Chart Analysis
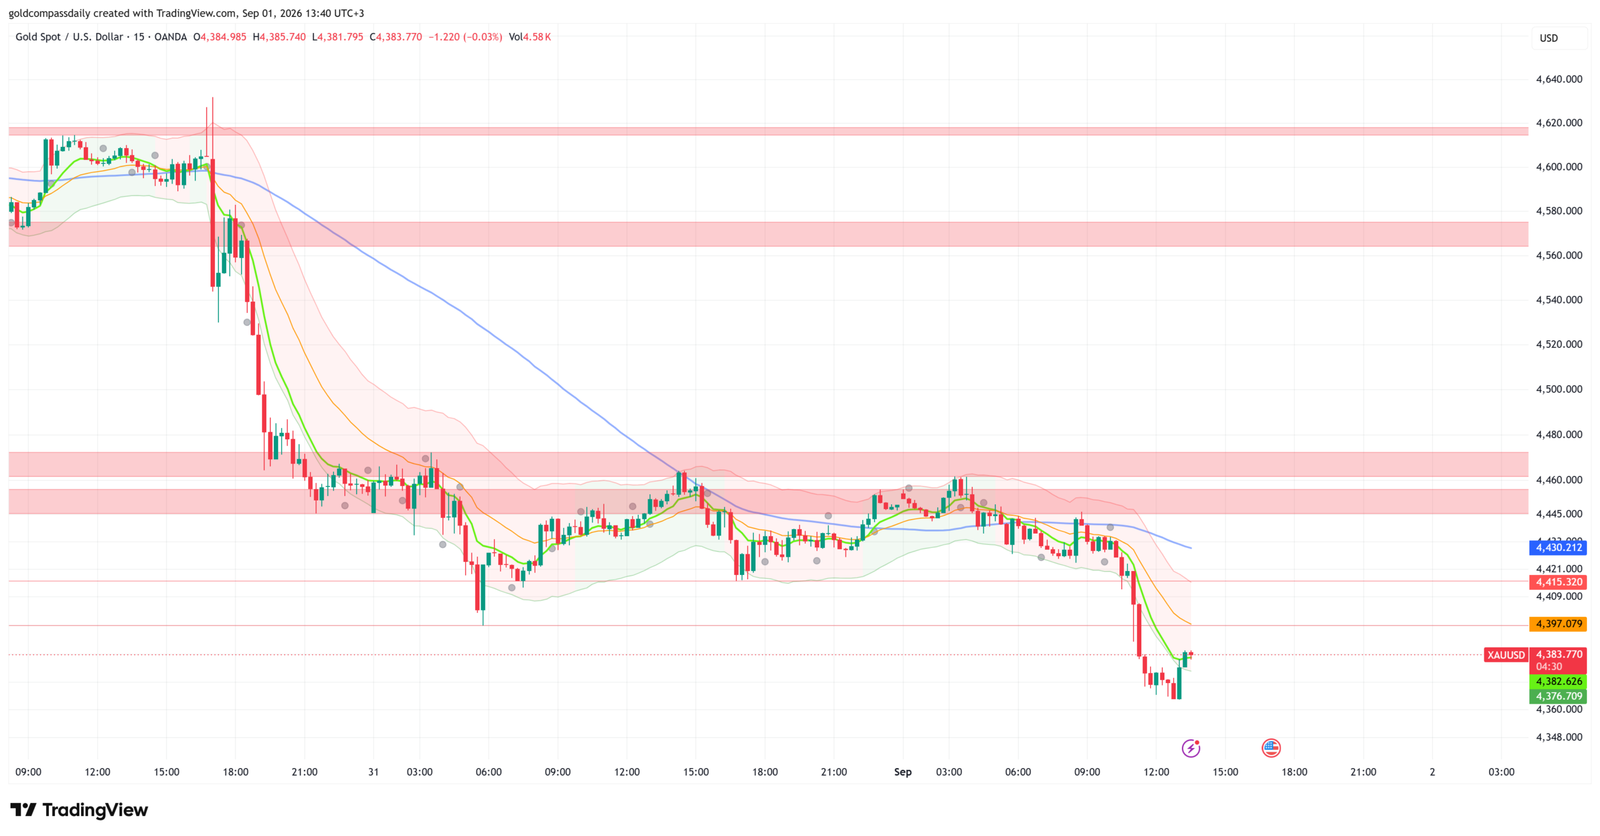
The updated 15-minute chart confirms a significant structural deterioration since the morning session. After holding the $4,420–$4,455 consolidation range through the early London hours, price broke lower with a sharp momentum candle through $4,400 — the level Gold Compass Daily’s morning analysis identified as the key invalidation threshold. The breakdown accelerated to a session low near $4,360 before a partial recovery bounce, with price now hovering around $4,383. All three moving averages visible on the chart — the fast EMA (green), the medium EMA (orange), and the slow SMA (blue) — are aligned bearishly in a downward stack, with price trading below all of them. The slow SMA (blue) has turned lower from approximately $4,430, confirming that the broader intraday trend has shifted from consolidation to distribution. The Bollinger Bands have re-expanded sharply to the downside following the breakdown, signaling a volatility expansion phase rather than the contraction seen in the morning. The session low near $4,360 is the only identifiable structural support within this range; below that, the chart shows limited historical congestion down to the $4,340 zone. The key resistance levels to watch into the NY session are $4,397 (where the fast EMAs are converging) and $4,415 (prior demand now acting as supply). A close back above $4,415 on strong volume would be the minimum requirement to revisit the morning’s buy thesis; absent that, the path of least resistance remains lower into the data catalysts.
Gold at $4,180: XAU/USD Eyes $4,190 as Canada CPI Looms
Gold trades cautiously bullish at $4,180 — price is holding above a…
Gold at $4,174: Gold Eyes US Import Prices, $4,200
Gold trades cautiously bullish at $4,174 — buyers defend every dip above…
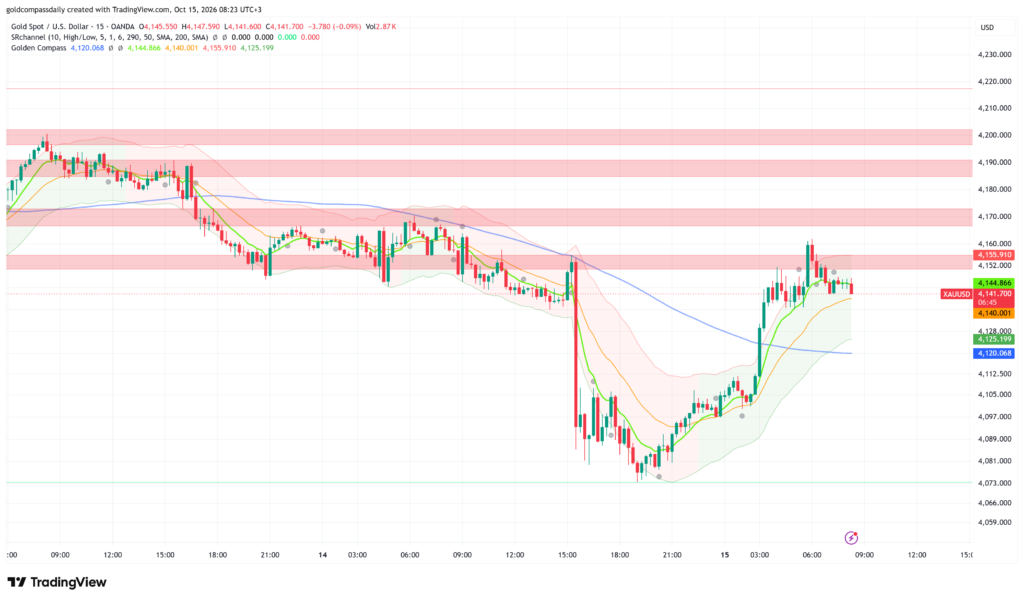
XAU/USD at $4,142: Gold Eyes US Retail Sales & PPI
Headline Thesis Gold trades cautiously bullish at $4,142 — the V-shaped recovery…
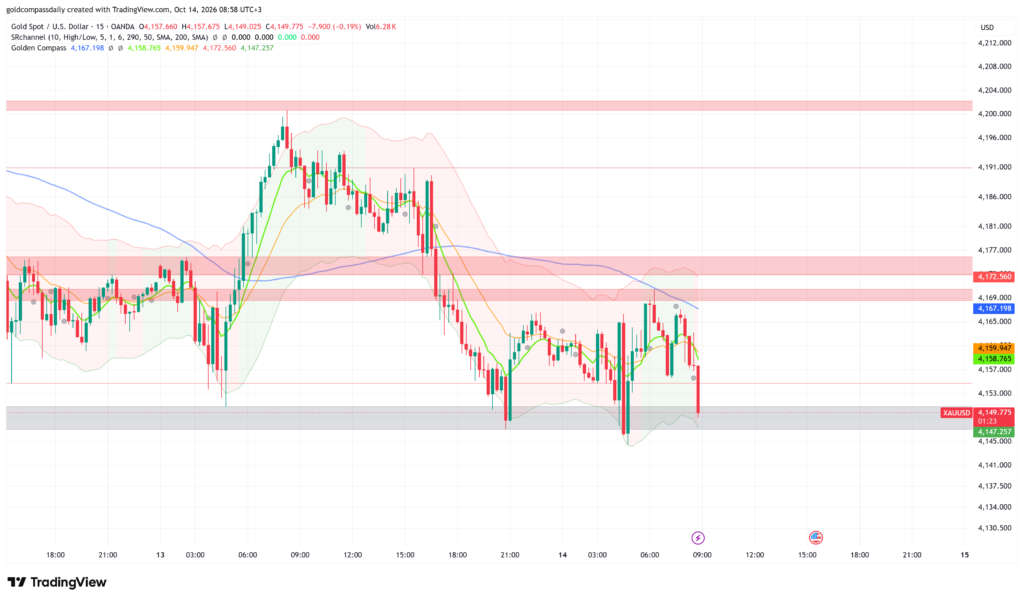
XAU/USD at $4,150: Gold Eyes Bounce Before US CPI
Gold trades cautiously bullish at $4,150 — the $4,145 floor has absorbed…
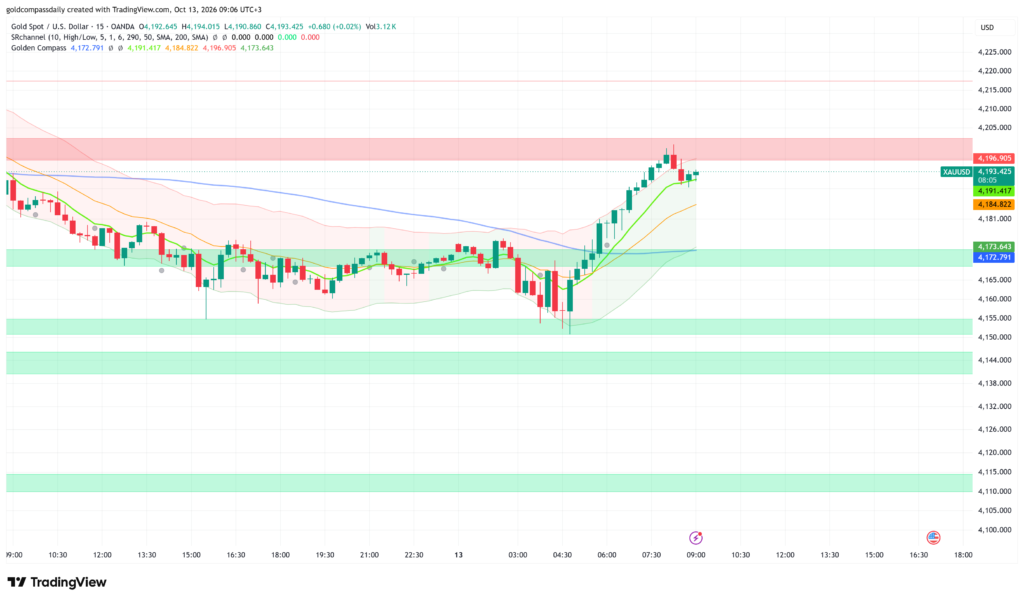
Gold at $4,193 Tests $4,200 Ahead of Waller
Gold trades cautiously bullish at $4,193 — a 50-dollar rebound from the…
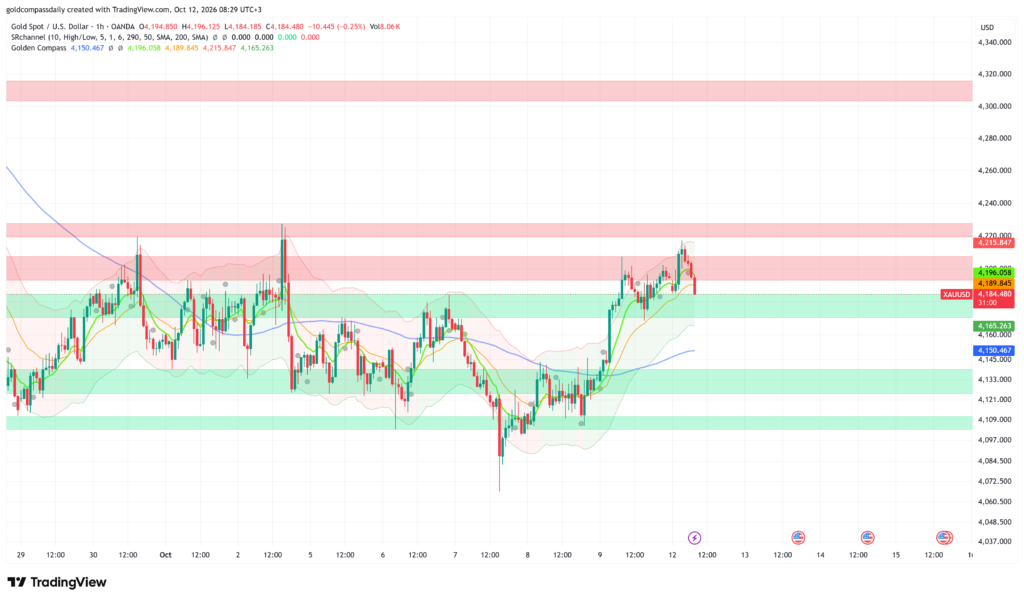
XAU/USD Gold $4,184: Bulls Defend 4,165 on Thin Volume
Gold trades cautiously bullish at $4,184 — the Friday breakout above $4,200…
New York Session Update
Price Check
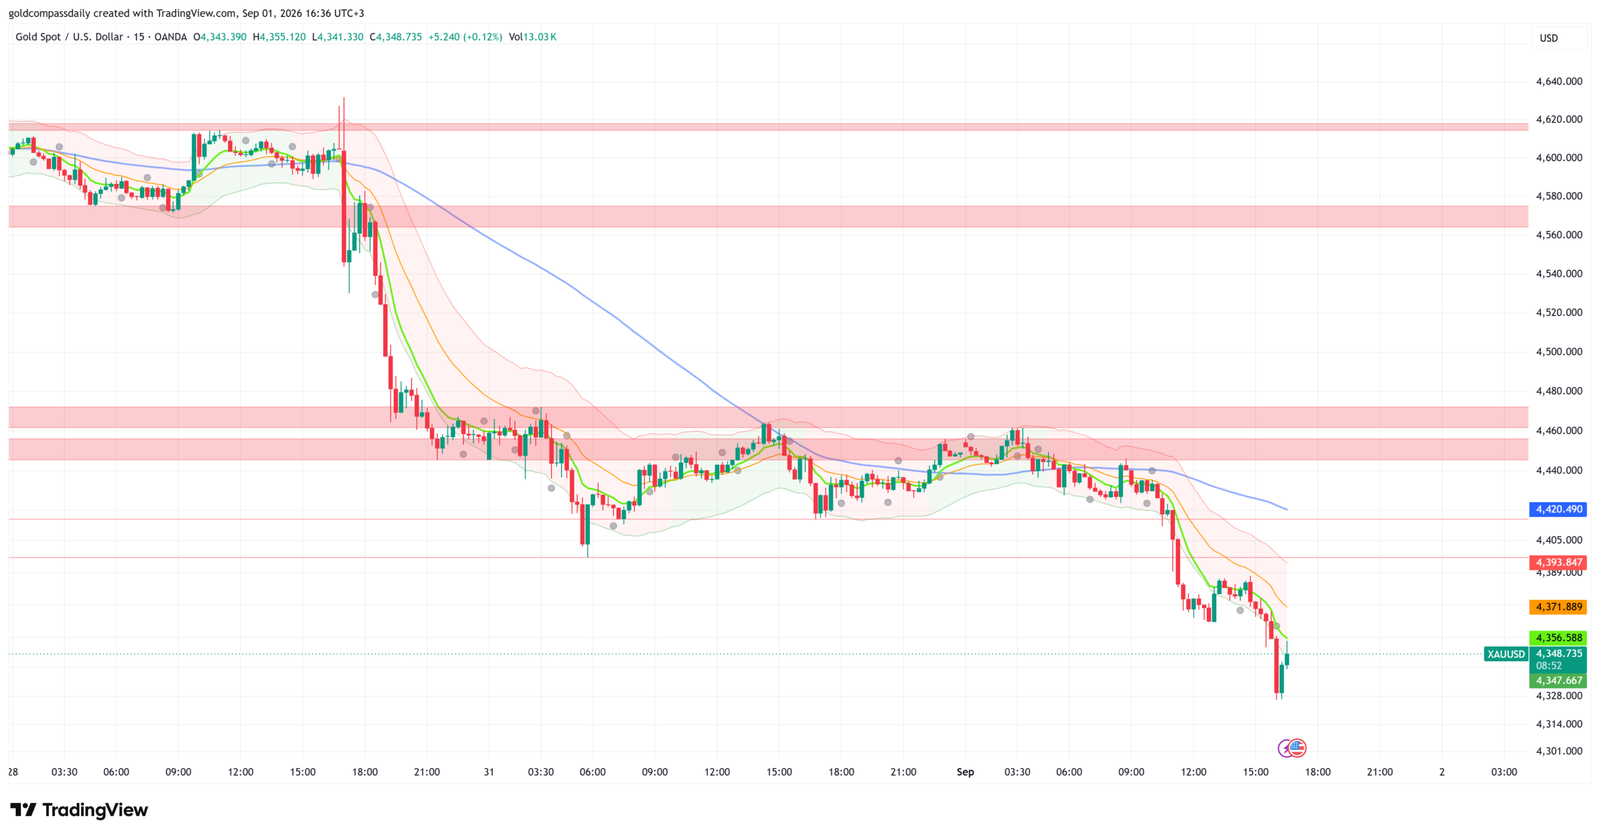
Gold is trading at $4,348 at the time of this update — the morning’s cautiously bullish thesis has been fully negated. Both the $4,420 invalidation flagged in the morning analysis and the $4,360 support identified in the London session update have been taken out, with price now printing fresh multi-day lows and the intraday trend firmly bearish.
What Changed
The catalyst was decisive: the New York open brought a double-beat on the session’s two key data releases. ISM Manufacturing PMI printed at 55.6 — matching the prior and beating the 55.2 forecast — while ISM Prices Paid came in at 71.1, above the 70.5 forecast and firmly in inflation-accelerating territory. JOLTS Job Openings registered 7.36M, meeting the prior and beating the 7.33M forecast. Taken together, the three prints delivered the worst-case scenario for gold that the morning analysis outlined: a hot data sweep that removes any remaining ambiguity about the September 15–16 FOMC decision. Markets moved immediately to price a September rate hike as near-certain, driving the two-year Treasury yield sharply higher and the US Dollar index to session highs. Gold responded with a momentum breakdown, slicing through $4,400, $4,380, $4,360, and into the $4,328 session low in rapid succession before a partial stabilisation near current levels. Volume spiked sharply on the breakdown candles, confirming the move as institutionally driven rather than a liquidity-hunt stop run.
Updated Levels
- Current price: $4,348
- Bias now: Bearish — all morning and London session support levels have failed; bias is now bearish until price reclaims $4,393 on a closing basis
- Updated support: $4,328 (session low, immediate base) → $4,301 (next structural extension zone visible on chart)
- Updated resistance: $4,356 (fast EMA overhead) → $4,371 (medium EMA) → $4,393 (slow EMA, key reclaim level)
- NY session target: $4,328 retest; break below opens $4,301 into the close
Scenarios into the Close
Bull: Price stabilises above $4,328 on declining volume and reclaims $4,356 — a short-covering bounce toward $4,371–$4,393 is possible into the NY close, but the structural bias remains bearish. Bear: A clean break and hourly close below $4,328 with sustained volume confirms the next leg lower, targeting $4,301 and opening the risk of a broader corrective move toward $4,270 into Wednesday’s session.
Chart Analysis
The 15-minute chart presents one of the most bearish structural configurations of the current multi-day selloff. Following the London session’s breakdown through $4,400, price attempted a brief consolidation in the $4,440–$4,460 range during mid-session — a range Gold Compass Daily’s London update identified as overhead resistance — before the NY open data triggered a second sharp leg lower. The breakdown from $4,420 to the session low near $4,328 is near-vertical, consistent with stop-cascade selling rather than orderly distribution. All three moving averages — the fast EMA (green), medium EMA (orange), and slow SMA (blue) — are stacked in maximum bearish alignment, with price well below all three. The slow SMA (blue) is now descending from approximately $4,420, confirming that even the medium-term intraday trend has rolled over. The Bollinger Bands have expanded dramatically to the downside, signalling a high-volatility trending environment rather than range conditions. The $4,328 session low is the only nearby structural reference; below it, the chart shows a clean air pocket down to the $4,301 zone, which corresponds to a horizontal support level visible on the left side of the chart. A meaningful recovery requires price to first reclaim the fast EMA near $4,356, then the medium EMA near $4,371 — both of which now represent active resistance. Until that sequence completes, any bounce should be treated as a corrective retracement within the established downtrend.
Analysis based on the XAU/USD 15-minute chart as of September 1, 2026, 08:31 UTC+3. This article is for informational and educational purposes only and does not constitute financial advice.
New York Close & Asian Session Outlook
NY Close
Gold closed the New York session at approximately $4,328 — firmly bearish — as every support level identified across Gold Compass Daily’s morning, London, and NY session updates was systematically taken out following the triple data beat from ISM Manufacturing, ISM Prices Paid, and JOLTS. The morning’s cautiously bullish thesis was invalidated in full; the session registered a day’s range from a high near $4,460 to a low of approximately $4,314, representing one of the sharpest single-session selloffs of the current correction.
Updated Key Levels
- NY Close: ~$4,328
- Session high: ~$4,460 | Session low: ~$4,314
- Bias into Asian session: Bearish below $4,361 — neutral only on a reclaim of $4,361 and hold
- Asian session support: $4,314 (session low) → $4,301 (next structural extension)
- Asian session resistance: $4,333 (fast EMA) → $4,343 (medium EMA) → $4,361 (key reclaim level, horizontal resistance)
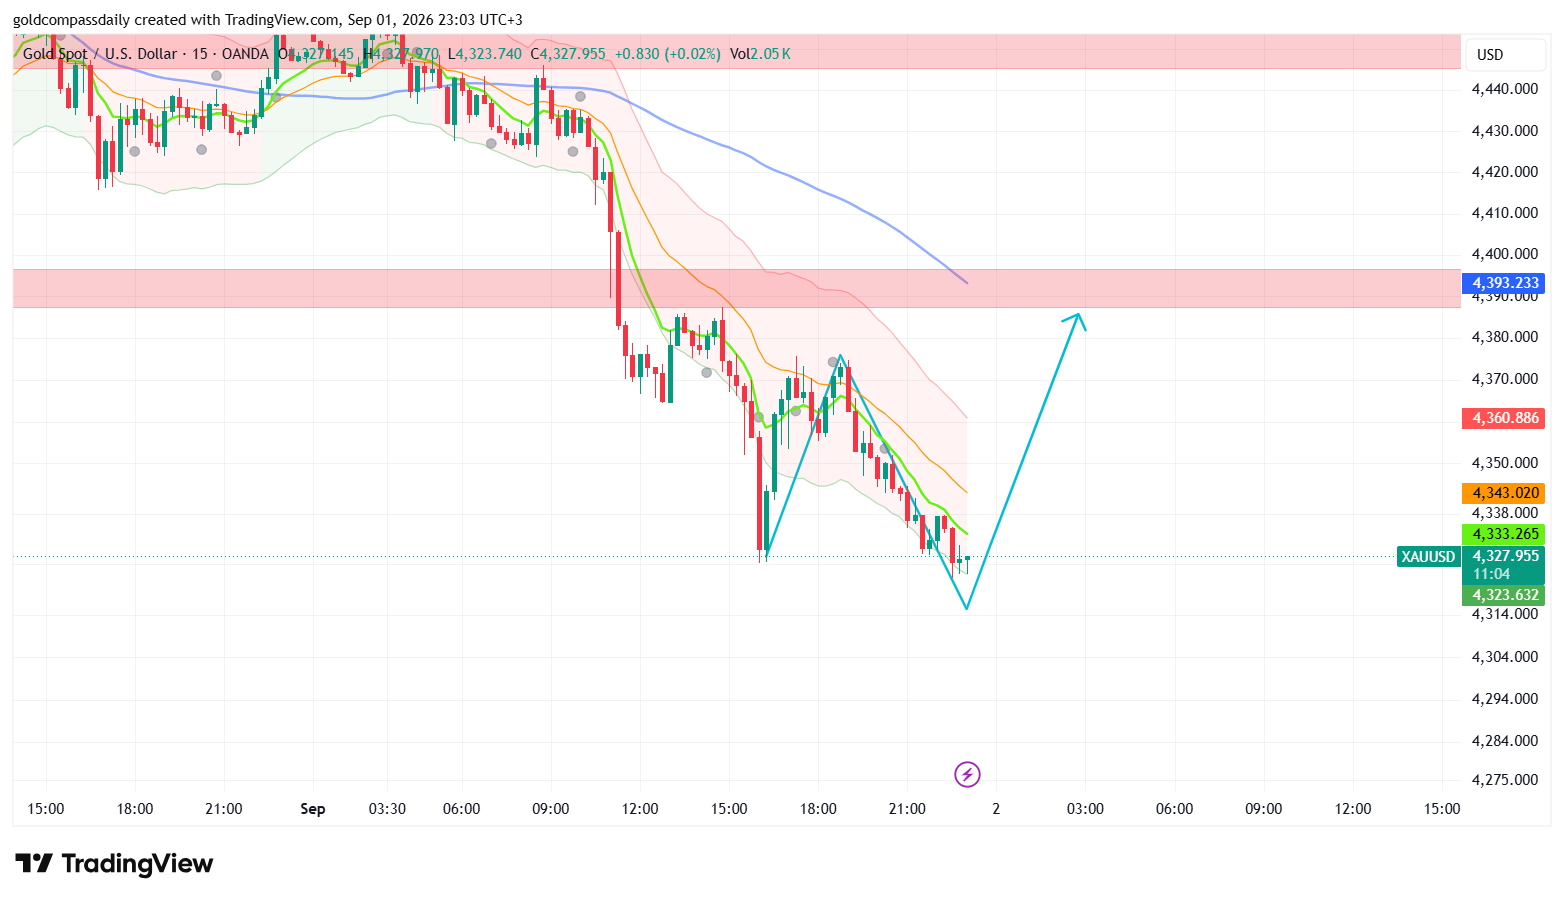
Chart Read at Close
The 15-minute chart at the NY close tells a clean bearish story with one developing nuance. Price closed well below all three moving averages — the fast EMA (green) near $4,333, the medium EMA (orange) near $4,343, and the slow SMA (blue) descending from $4,393 — confirming maximum bearish MA alignment. The Bollinger Bands remain wide and pointing lower, consistent with a trending sell environment rather than consolidation. The closing candle structure shows a small-bodied recovery attempt off the $4,314 session low, consistent with short-cover stabilisation rather than genuine demand. The most important feature of the chart is the annotated projected path: a V-shaped cyan arrow indicating one more leg lower — toward the $4,301–$4,314 zone — before a recovery attempt targets $4,380–$4,393. The $4,361 horizontal level (marked in red on the chart) is the key overhead reference; it now functions as the ceiling that separates corrective bounce from genuine recovery. The green demand zone visible in the lower right of the chart sits between approximately $4,314 and $4,328 — this is the base the chart is suggesting could hold for the Asian session bounce.
Asian Session Outlook
The Asian session (00:00–09:00 UTC+3) is expected to be low-volume and range-bound, with a probable liquidity sweep of the $4,314 NY session low before any stabilisation. Asian hours typically lack the macro catalyst weight to reverse a momentum move of this magnitude; the more likely sequence is a shallow grind within the $4,314–$4,343 range, with the fast and medium EMAs acting as a dynamic ceiling on any bounce attempt. The level the Asian session is most likely to test is $4,301 — the next clean support below the NY low — before the projected path suggests a recovery attempt into the London open. A clean sweep of $4,314 followed by a reclaim and hold above that level going into London would be the first constructive signal that a short-term base is forming.
Wednesday Scenarios
Bull trigger: Asian session holds above $4,314, London open confirms a higher low, and price reclaims $4,361 with a 15-minute close above — targets $4,393 (slow SMA) and potentially $4,420 if the recovery extends into the NY session. Bear trigger: Asian session sweeps $4,314 and fails to reclaim it, with a confirmed 15-minute close below $4,301 — next downside targets are $4,270 and $4,240, the pre-ATH consolidation zone from July.
Wednesday’s Key Events
- 15:15 UTC+3 — ADP Employment Change (forecast: ~160K): The first major labour market print ahead of Friday’s NFP — a beat above 180K would cement September hike expectations and extend gold’s selloff; a miss below 130K is the first catalyst that could trigger a meaningful gold recovery.
- 17:30 UTC+3 — Fed speakers (multiple expected): Post-ISM commentary will be parsed closely for any September hike confirmation or pushback; any dovish dissent could trigger a sharp short-covering bounce in gold.
- All day — G20 Meetings (Day 5): Geopolitical headlines from the G20 remain a wildcard for safe-haven demand; any escalation in US–Iran or broader risk-off positioning could provide a floor for gold independent of rate dynamics.
Analysis based on the XAU/USD 15-minute chart as of September 1, 2026, 08:31 UTC+3. This article is for informational and educational purposes only and does not constitute financial advice.