

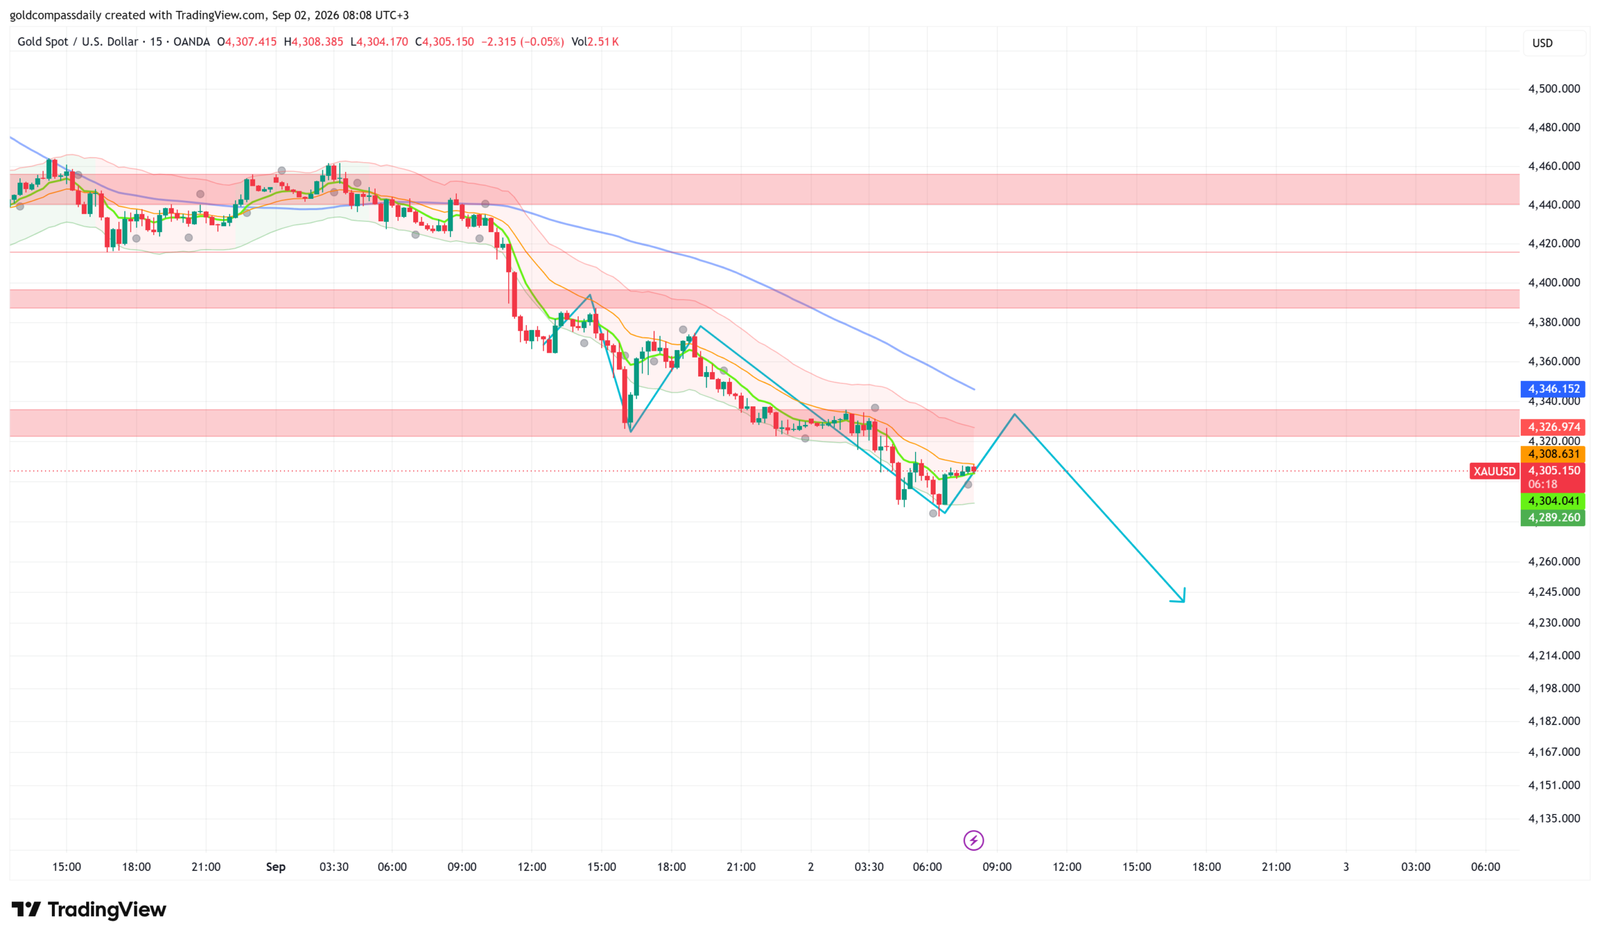
Gold trades bearish at $4,305 as of the September 2 European session, consolidating tightly below the $4,327 resistance zone after a sustained multi-day decline from the $4,460 area. The bearish structure remains intact across the 15-minute chart, with all short-term moving averages sloping downward and price unable to reclaim key structural levels. Today’s primary session risk is the ADP Non-Farm Employment Change at 3:15pm UTC+3, which will determine whether gold breaks lower toward the $4,260–$4,245 target zone or stages a temporary relief rally.
Key Levels
- Bias: Bearish below $4,327
- Support: $4,289 → $4,260
- Resistance: $4,320 → $4,327 → $4,346
- Session target: $4,245 (conditional on ADP beat above 47K and dollar strength follow-through)
- Invalidation: Sustained close above $4,346 = short-term bearish structure compromised; neutral reassessment required
Catalyst of the Day
The ADP Non-Farm Employment Change (3:15pm UTC+3) is the primary session catalyst. Consensus expects 47K new private-sector jobs, building on last month’s 44K print. A result at or above consensus signals a resilient U.S. labor market, which reduces the probability of near-term Fed rate cuts and strengthens the dollar — both directly bearish for gold. The ADP report also functions as a directional primer ahead of Friday’s NFP release. A beat above 60K would represent a material hawkish surprise and is the clearest path to accelerated selling pressure in XAU/USD. Watch price action at the $4,320 resistance level in the 30 minutes preceding the release: if gold cannot push above it before 3:15pm, the bias for a downside break is reinforced.
Fundamental Context
The macro backdrop continues to work against gold in the near term. The Federal Reserve, under Chair Kevin Warsh, has maintained a hawkish tone even as inflation data has moderated, signaling that rate cuts remain contingent on sustained softness in labor market conditions. Strong employment data — as a beat in today’s ADP would confirm — directly undermines the rate-cut narrative that has been one of gold’s primary fundamental supports in 2026. With real yields holding at elevated levels, the opportunity cost of holding non-yielding gold remains high, limiting the scale of any short-term recovery.
Elsewhere, the Bank of Canada holds rates at 2.25% today (4:45pm UTC+3), with no change expected. While the BOC decision is not a direct driver for XAU/USD, the accompanying press conference at 5:30pm carries the potential to shift broader risk sentiment if Governor Macklem signals concern about global growth. A dovish BOC tone could modestly support gold as a safe-haven, but Gold Compass Daily does not consider this a primary catalyst — it remains a secondary tail risk. The U.S. Beige Book release at 9:00pm UTC+3 carries more weight for gold, as anecdotal evidence of labor market softening in Fed districts would be interpreted as incrementally supportive of easing and could trigger a late-session bounce in the metal.
Chart Analysis
The 15-minute XAU/USD chart as of 08:08 UTC+3 on September 2 shows gold printing at $4,305.15 after a clean structural decline from the $4,460 zone visible on the left of the chart. Price has been forming a short consolidation pattern in the $4,289–$4,327 range, with what appears to be a small double-bottom structure around the $4,289–$4,295 lows — though this has not generated a sustained breakout and is better interpreted as temporary demand absorption rather than a reversal signal. The 15-period and 50-period moving averages are both sloping downward and acting as dynamic resistance, capping relief rallies near $4,320–$4,327. The blue descending trendline from the $4,460 high passes through the current price area, adding further confluence to the resistance cluster. The annotated chart projection shows a brief consolidation attempt toward $4,340, followed by rejection and continuation lower toward $4,245 — a target consistent with the measured move from the $4,380 breakdown level. Volume (2.51K on the current candle) remains low during the European pre-market, typical for this session window, and does not yet confirm direction. The structure remains bearish until price demonstrates a convincing close above $4,346 on the 15-minute chart.
Bull / Bear Scenarios
Bear Trigger
Condition: ADP prints at or above 47K consensus and price holds below $4,320 into the release → Target: $4,260, extended to $4,245. Entry on a confirmed break and close below $4,289 on the 15-minute chart. This is the base case aligned with current chart structure and sell bias.
Bull Trigger
Condition: ADP prints materially below consensus (below 30K) or misses significantly, prompting dollar weakness → price must close above $4,346 on the 15-minute chart to invalidate the bearish structure → Target: $4,380, then $4,400. This scenario is lower probability given current chart structure but would be triggered by a labor market surprise that reignites rate-cut expectations.
Events Ahead
- Wednesday 3:15pm UTC+3 — USD ADP Non-Farm Employment Change (forecast: 47K): Primary session catalyst; a beat strengthens the dollar and accelerates selling pressure in gold.
- Wednesday 4:45pm UTC+3 — CAD Overnight Rate & BOC Rate Statement (forecast: 2.25%, no change): Secondary risk event; dovish press conference language could briefly support gold as a safe-haven.
- Wednesday 5:00pm UTC+3 — USD Factory Orders m/m (forecast: 0.7%): A strong print reinforces the hawkish U.S. data narrative and adds incremental bearish pressure on gold.
- Wednesday 5:30pm UTC+3 — USD Crude Oil Inventories (forecast: -0.4M): Indirect gold driver via inflation and risk sentiment; a larger-than-expected draw could briefly lift inflation expectations.
- Wednesday 9:00pm UTC+3 — USD Beige Book: Anecdotal Fed district data; any language pointing to labor market softening would be the clearest late-session upside risk for gold.
- Friday — USD Non-Farm Payrolls (week’s primary event): The definitive labor market reading that will set gold’s direction into the following week. Current consolidation may partially reflect positioning ahead of this release.
For broader macro context and the weekly framework governing this week’s key levels and scenarios, see the Gold Compass Daily weekly hub. For yesterday’s full analysis and prior session levels, see the September 1 XAU/USD report.
With the consolidation range holding between $4,289 and $4,327, the session outcome hinges on the 3:15pm ADP print. A jobs beat drives the next leg lower toward $4,245; a meaningful miss introduces short-covering risk toward $4,380. The bearish bias remains intact until the chart says otherwise.
London Session Update
Price Check
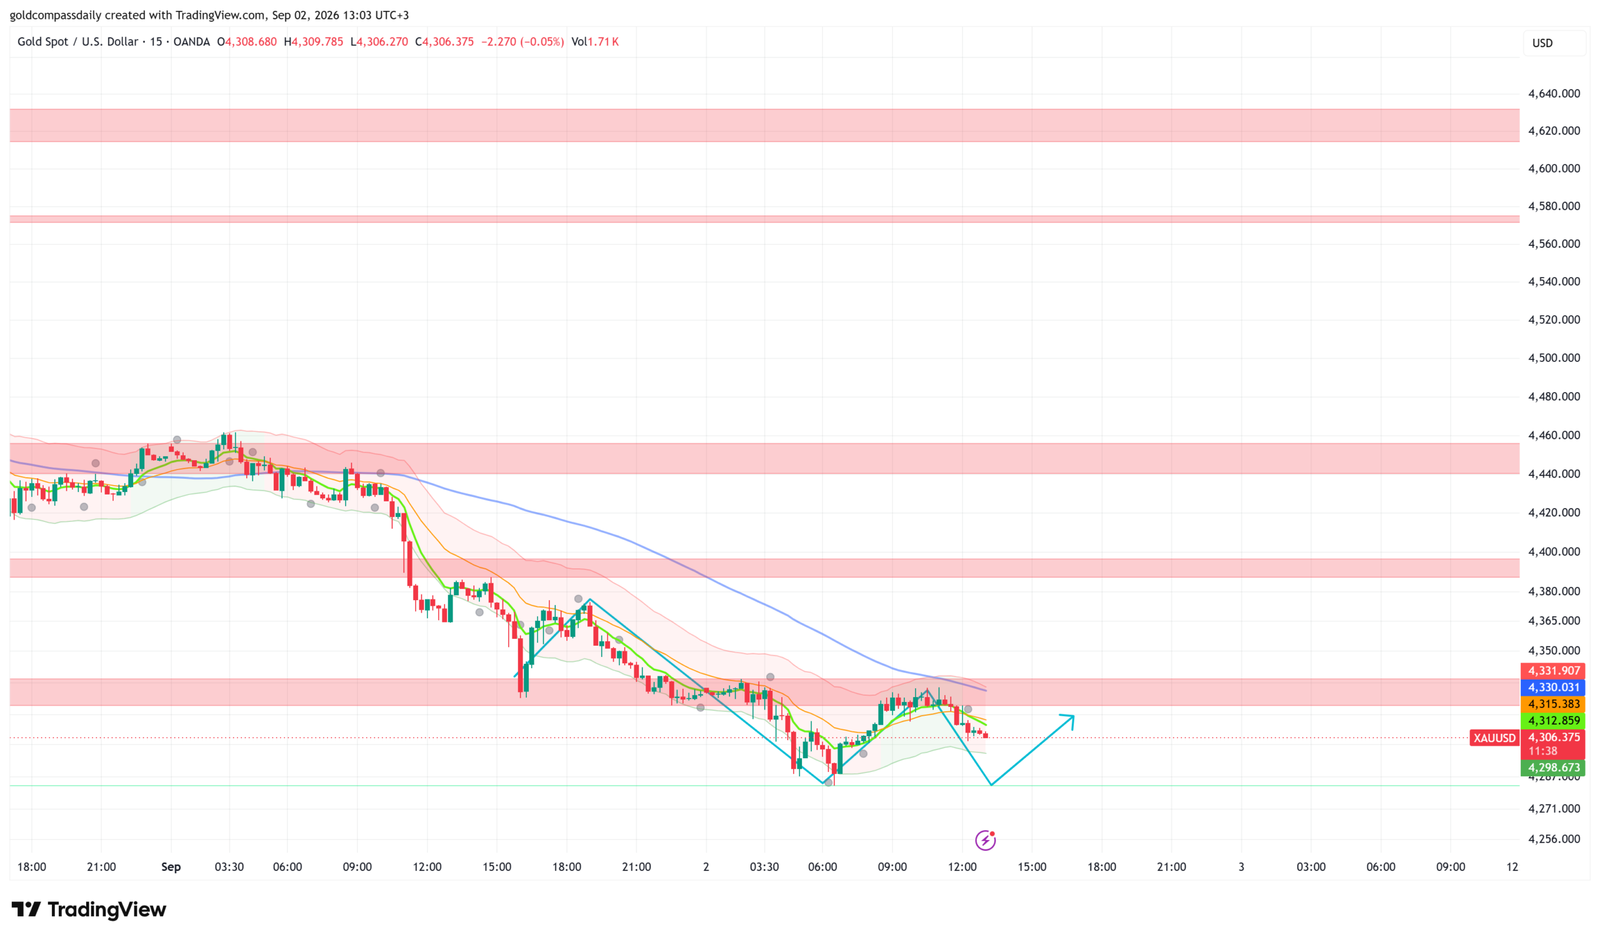
Gold trades at $4,306 at 13:03 UTC+3, holding within the same consolidation band flagged in the morning analysis and confirming that the bearish structure has not broken down but has also not yet extended lower. The sell bias from Gold Compass Daily’s morning analysis remains intact — price has failed to reclaim $4,327 and continues to search for a demand zone capable of absorbing further selling pressure.
What Changed
The session’s primary development is the price action between the $4,295 area low printed around 06:00 UTC+3 and the subsequent recovery attempt toward $4,315–$4,320. This intraday dip and bounce is consistent with short-term demand absorption rather than a structural reversal — moving averages remain in a bearish configuration and the descending blue trendline continues to cap upside. No material European data has altered the macro picture: Spanish unemployment came in at 15.4K versus the 19.5K prior, a marginal improvement that carries no direct weight for gold. The dollar has shown modest stability, offering no relief catalyst. The chart projection annotated on the current chart now shows a potential short-term bounce toward $4,330–$4,331 before the next leg lower — a pattern consistent with a bear flag resolution ahead of the 3:15pm UTC+3 ADP release.
Updated Levels
- Current price: $4,306
- Bias now: Bearish — unchanged; consolidation has not invalidated the morning structure
- Updated support: $4,298 → $4,271
- Updated resistance: $4,315 → $4,330 → $4,331
- London session target: $4,298 (on ADP beat); bounce to $4,330 possible pre-release
Scenarios into the NY Handoff
Bull: ADP prints below 30K, price closes above $4,331 on the 15-minute chart → squeeze toward $4,365 and the $4,400 zone. Bear: ADP meets or beats 47K consensus, price fails at $4,315–$4,320 resistance into the release → break below $4,298 opens the path to $4,271 and the morning’s $4,245 session target.
Chart Analysis
The updated 15-minute chart as of 13:03 UTC+3 shows gold continuing to trade within a compressed range after the earlier session low near $4,295. A small accumulation structure has formed between $4,295 and $4,315, with price currently sitting at $4,306 — mid-range and indecisive. The short-term moving averages have begun to flatten and are converging around $4,310–$4,315, which now acts as the immediate ceiling before the more significant $4,330–$4,331 resistance cluster visible as a horizontal zone on the right side of the chart. The blue descending trendline from the $4,460 highs continues to apply overhead pressure, crossing through the $4,330 area. The annotated projection on the chart suggests a relief push toward $4,330 followed by rejection and continuation toward the $4,256–$4,271 zone — a read that aligns with the bearish thesis and supports treating any pre-ADP bounce as a potential sell opportunity rather than a reversal signal. The broader resistance zones at $4,400 and $4,440–$4,460 remain unthreatened.
Gold at $4,180: XAU/USD Eyes $4,190 as Canada CPI Looms
Gold trades cautiously bullish at $4,180 — price is holding above a…
Gold at $4,174: Gold Eyes US Import Prices, $4,200
Gold trades cautiously bullish at $4,174 — buyers defend every dip above…
XAU/USD at $4,142: Gold Eyes US Retail Sales & PPI
Headline Thesis Gold trades cautiously bullish at $4,142 — the V-shaped recovery…
XAU/USD at $4,150: Gold Eyes Bounce Before US CPI
Gold trades cautiously bullish at $4,150 — the $4,145 floor has absorbed…
Gold at $4,193 Tests $4,200 Ahead of Waller
Gold trades cautiously bullish at $4,193 — a 50-dollar rebound from the…
XAU/USD Gold $4,184: Bulls Defend 4,165 on Thin Volume
Gold trades cautiously bullish at $4,184 — the Friday breakout above $4,200…
New York Session Update
Price Check
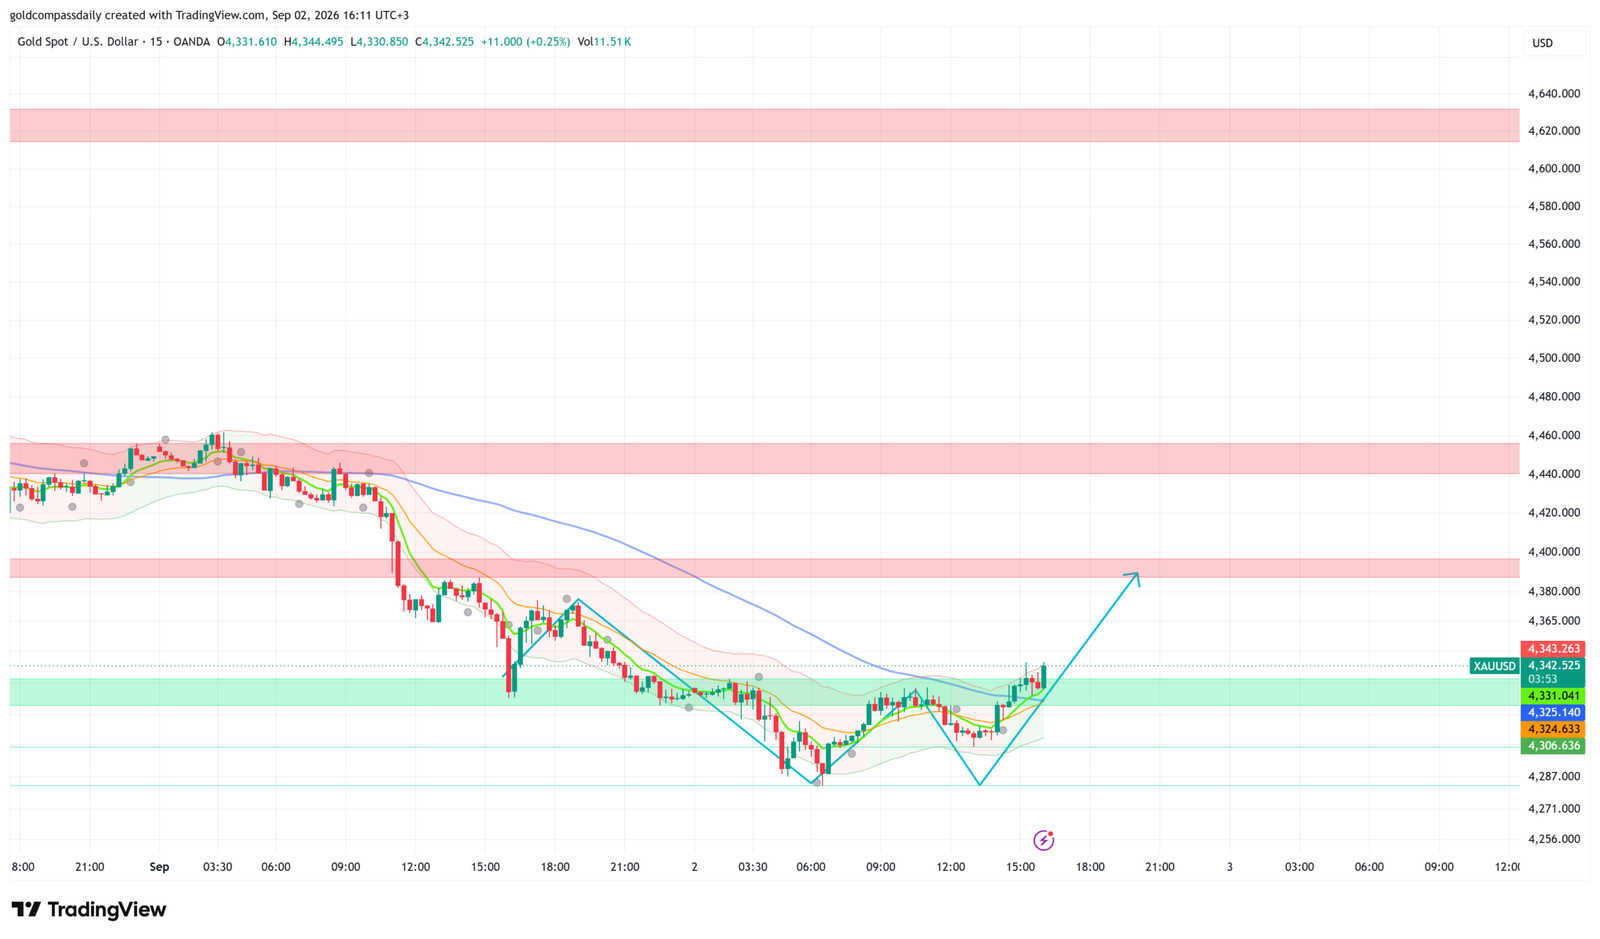
Gold has surged to $4,342.52 at 16:11 UTC+3, decisively invalidating the morning sell bias and clearing the $4,331 resistance level that Gold Compass Daily’s morning analysis identified as the key invalidation threshold. The bearish structure has failed — price found support at the $4,295 area and has since posted a sharp $47 recovery into the NY open.
What Changed
The catalyst was the ADP Non-Farm Employment Change, which printed well below the 47K consensus, triggering immediate dollar weakness and a squeeze in short positions across gold. Price broke above the $4,315 and $4,330–$4,331 resistance levels in rapid succession on elevated volume (11.51K on the current candle versus the sub-2K readings during the London session), confirming this is not a low-conviction drift but a momentum-driven reversal. The short-term moving averages on the 15-minute chart have begun to curl upward and price is now trading above them for the first time since the decline from $4,460 began — a meaningful structural shift. The green demand zone between $4,306 and $4,331 visible on the chart has now been fully reclaimed and is acting as support on the first retest.
Updated Levels
- Current price: $4,342.52
- Bias now: Bullish — morning sell bias invalidated; structure flipped on ADP miss and volume confirmation above $4,331
- Updated support: $4,325 → $4,306
- Updated resistance: $4,343 → $4,365 → $4,400
- NY session target: $4,380–$4,390 (conditional on holding above $4,325 on any pullback)
Scenarios into the Close
Bull: Price holds above $4,325 on the first meaningful pullback and the Beige Book at 9:00pm UTC+3 contains any language pointing to labor market softness → continuation toward $4,380 and the $4,400 zone. Bear: Price fails to hold $4,325 and reverses back below $4,306 on a 15-minute close → the spike is treated as a false breakout and the prior bearish structure reasserts toward $4,271.
Chart Analysis
The 15-minute chart as of 16:11 UTC+3 shows a clean V-shaped recovery from the session low near $4,287–$4,295, with the rally accelerating sharply into the NY open and price printing a high of $4,344.49 before the current candle closes at $4,342.52. The green support zone between $4,306 and $4,331 has been reclaimed with authority — the first pullback to this zone held cleanly and the subsequent push higher confirms it as demand. The short-term moving averages (15 and 50-period) are beginning to slope upward and price is printing above them, ending the sustained bearish MA configuration that defined the earlier session. The annotated chart projection shows a continuation higher toward $4,380–$4,390 before a potential consolidation. The blue descending trendline from the $4,460 highs, which acted as resistance through the London session, now sits near $4,365 and represents the next meaningful overhead hurdle — a clean break above that level on a 15-minute close would open the $4,400 resistance zone. The $4,440–$4,460 macro resistance band visible at the top of the chart remains the longer-term ceiling. Volume at 11.51K confirms institutional participation in this move and reduces the probability that today’s recovery is a short-lived technical squeeze.
New York Close & Asian Session Outlook
NY Close
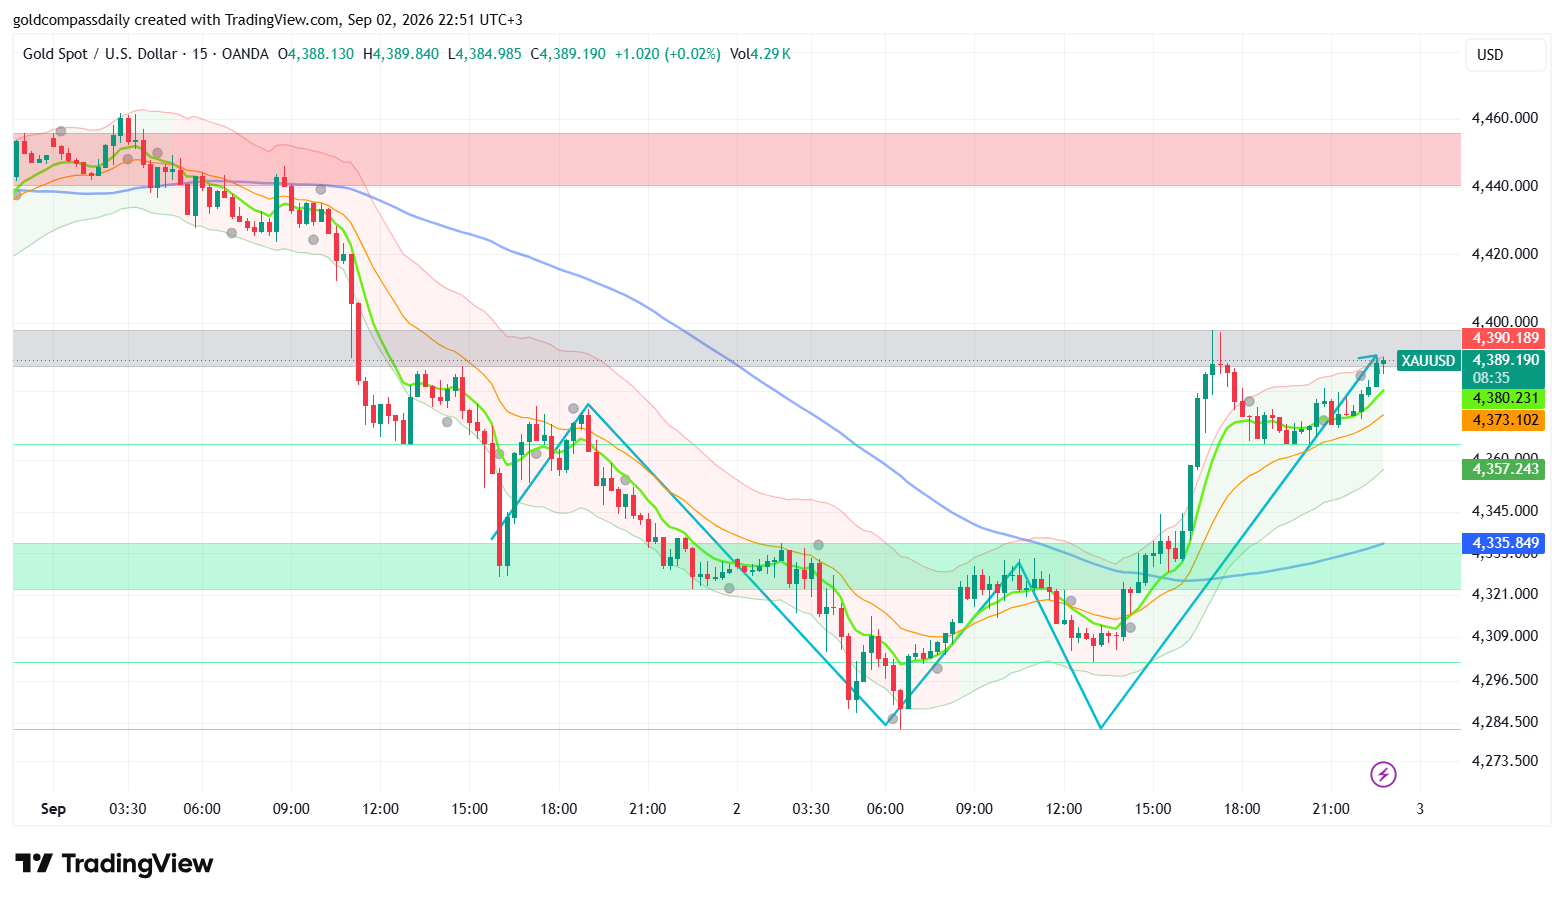
Gold closed the New York session at $4,389.19 — bullish — decisively confirming the intraday reversal flagged in the NY session update and fully invalidating Gold Compass Daily’s morning sell bias. From a session low of $4,284.50 to a high of $4,389.84, gold posted a $105 intraday recovery driven by the ADP miss and sustained buying through the NY afternoon, closing at the top of the daily range with buyer control intact.
Updated Key Levels
- NY Close: $4,389.19
- Session high: $4,389.84 / Session low: $4,284.50
- Bias into Asian session: Bullish above $4,357
- Asian session support: $4,357 → $4,335
- Asian session resistance: $4,390 → $4,400 → $4,440–$4,460
Chart Read at Close
The 15-minute chart at 22:51 UTC+3 shows gold printing at $4,389.19, sitting directly at the upper boundary of the $4,390 resistance dotted line visible on the chart. The short-term moving averages (15 and 50-period) have fully reversed course — both are sloping upward sharply with price trading well above them, a clean structural shift from the bearish configuration that defined the Asian and London sessions. The green demand zone between $4,321 and $4,335 has been reclaimed and is now established as the key pullback support for the Asian session. The Bollinger Bands have expanded significantly to the upside, with price pinned to the upper band — consistent with strong momentum but also flagging the possibility of a mean-reversion consolidation during the low-liquidity Asian window. The annotated cyan projection on the chart points upward toward the $4,400 zone, implying continuation is the base case provided $4,357 holds on any pullback. The closing candle is a small-bodied candle near the session high, indicating buyers remain in control with minimal late-session selling pressure.
Asian Session Outlook
The Asian session (00:00–09:00 UTC+3) is expected to be range-bound to mildly bullish, with price likely to consolidate between $4,357 and $4,400 as thin liquidity limits directional conviction. The most probable sequence is a brief liquidity sweep toward the $4,357 support — the former resistance level that gold broke through during the NY rally — before stabilizing and setting up for the London open. A clean hold above $4,357 through the Asian session would represent a bullish continuation structure heading into Thursday. A deeper pullback toward the $4,335 green demand zone cannot be ruled out but would be consistent with normal post-momentum consolidation rather than a reversal signal.
Next Day Bull / Bear Scenarios
Bull trigger: Asian session holds above $4,357 and London open pushes a 15-minute close above $4,400 → continuation toward $4,440 and the upper macro resistance zone at $4,460. Bear trigger: Price loses $4,335 on a 15-minute close during Asian or early London session → intraday structure weakens and a retest of $4,306–$4,295 becomes the priority.
Tomorrow’s Key Events
- Thursday, time TBC UTC+3 — USD Unemployment Claims (weekly): Following today’s ADP miss, a second consecutive weak labor print would compound rate-cut expectations and extend gold’s bid.
- Thursday, time TBC UTC+3 — USD ISM Services PMI: A contraction reading below 50 would signal broad economic softening — directly supportive of gold as a safe-haven and rate-cut proxy.
- Friday — USD Non-Farm Payrolls: The week’s defining event; today’s ADP print has raised the probability of a NFP miss, which would be the catalyst for a test of $4,440–$4,460 macro resistance.
Analysis based on the XAU/USD 15-minute chart as of September 2, 2026, 08:08 UTC+3. This article is for informational and educational purposes only and does not constitute financial advice.