

Gold trades cautiously bullish at $4,331 as the metal tests a newly formed resistance zone at $4,340, with the Federal Reserve’s rate decision on Wednesday carrying near-certain hike odds that will define the trajectory for the remainder of the week. Price action is consolidating after Friday’s sharp recovery from the $4,282 floor, and the 15-minute structure shows buyers defending the $4,316–$4,325 support band while sellers assert themselves at the $4,340 ceiling. The session opens on a positioning note — no high-impact U.S. data lands today, making this a FOMC pre-positioning session where direction will be determined by how bulls manage the $4,340 test.
Key Levels
- Bias: Cautiously Bullish above $4,316 | Bearish on a close below $4,300
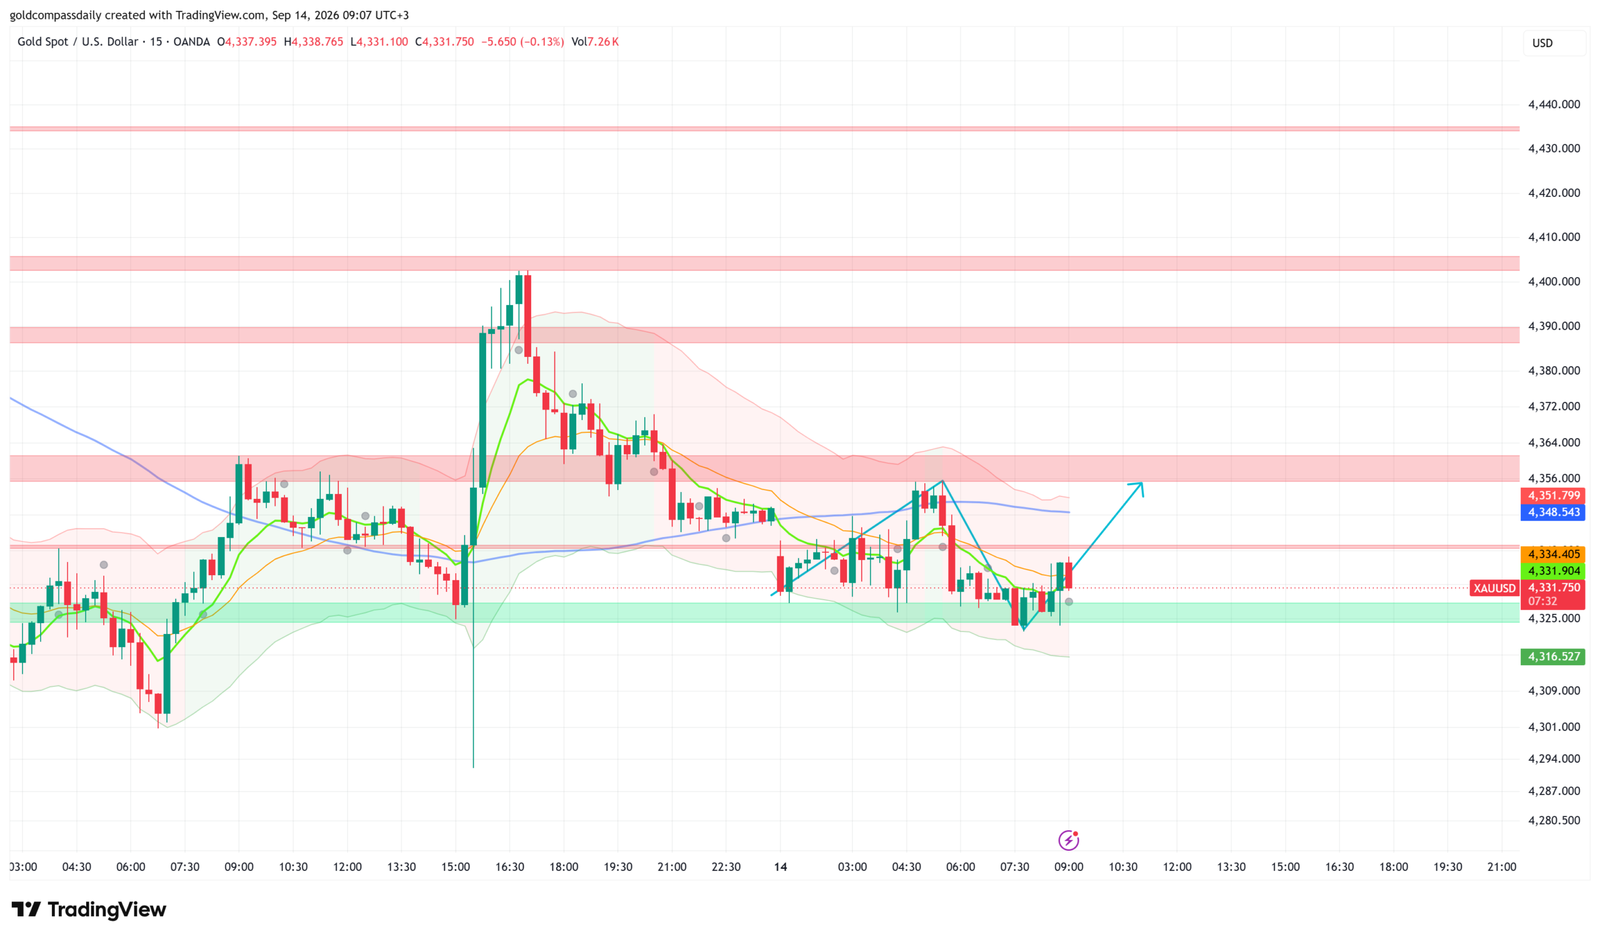
- Support: $4,325 → $4,316 (green band on chart) → $4,282 (weekly low / H&S neckline)
- Resistance: $4,340 (new resistance zone, current test) → $4,364 → $4,390
- Session target: $4,351–$4,355 (conditional on a clean hourly close above $4,340)
- Invalidation: Below $4,282 = Head-and-Shoulders neckline breach, opens path to $4,200
Catalyst of the Day
The sole market-moving catalyst on today’s calendar is ECB President Lagarde’s speech at 6:15 PM ET, which will be monitored for forward guidance on European rate policy. Any hawkish tilt from Lagarde strengthens the EUR/USD cross and typically provides a mild tailwind for gold by softening dollar demand. More critically for gold, today’s session is defined by what is absent: with FOMC deliberations beginning tomorrow (September 15) and the rate decision landing Wednesday at 2:00 PM ET, institutional desks are managing position risk rather than adding directional exposure. Watch the $4,340 zone through the London close — a sustained hold above this level into New York hours signals that buyers are comfortable carrying longs into the decision.
Fundamental Context
The dominant macro driver for gold this week is the Federal Reserve meeting on September 15–16, where the FOMC will also release its updated Summary of Economic Projections and dot plot alongside the rate decision. CME FedWatch data places the probability of a 25-basis-point hike to the 3.75%–4.00% range at approximately 85%, reflecting the cumulative hawkish repricing that followed hotter-than-expected August CPI and PPI prints last week. A rate hike is historically negative for gold because it raises real yields — the opportunity cost of holding a non-yielding asset — and supports the U.S. dollar. Gold’s ability to hold above $4,300 despite this pricing tells the market something important: safe-haven and dollar-debasement demand are partially offsetting the rate headwind.
That offsetting demand has structural foundations. The Fed’s current rate range of 3.50%–3.75% was held unanimously at the July meeting, but three FOMC dissents called for an immediate hike at that session. Core PCE inflation remains near 3.7%–4.1% on a six-month basis, well above the 2% target, and Fed Chair Warsh’s Jackson Hole keynote explicitly identified inflation as the Committee’s primary focus. For gold, the critical variable on Wednesday is not just the rate decision itself — now largely priced in — but the updated dot plot and Warsh’s press conference tone. A hike accompanied by dovish dot plot revisions (signalling the end of the tightening cycle) could trigger a sharp gold recovery toward $4,390. A hike with a hawkish dot plot extending the projected rate path into 2027 would renew pressure toward $4,282.
Chart Analysis
The 15-minute XAU/USD chart as of 09:07 UTC+3 on September 14 shows price at $4,331.75, recovering from an intraday low of $4,316.53 and testing the $4,331–$4,334 area. The green support band between $4,316 and $4,325 has held on two retests this morning, consistent with the analyst-identified demand zone. The $4,340 resistance is clearly defined as a newly formed ceiling — price spiked through $4,400 on the prior session before reversing sharply, leaving behind a structural imbalance and a supply zone that now compresses from $4,340 up through $4,364. The orange and green short-term moving averages have crossed bearishly after the $4,405 spike, and price is trading below both lines, confirming that the near-term momentum structure favors sellers above $4,340. However, the blue longer-period moving average is rising, indicating the broader trend remains constructive. The projected path annotated on the chart — a bounce from the $4,316–$4,325 floor targeting $4,348–$4,351 — aligns with Gold Compass Daily’s session target. A clean break above $4,340 on volume would open the first cluster of supply at $4,364, with $4,390 as the next significant horizontal barrier.
Bull and Bear Scenarios
Bull Trigger
A 15-minute candle closing above $4,340 with follow-through volume → targets $4,351 → $4,364 intraday. Post-FOMC bull case: hike delivered but dot plot signals end of cycle → gold recovers toward $4,390–$4,400 within 24 hours.
Bear Trigger
Rejection at $4,340 and failure to hold $4,316 on a 30-minute close → targets $4,295–$4,282. Post-FOMC bear case: hike plus hawkish dot plot revision → confirmed Head-and-Shoulders breakdown targets $4,200 over 2–3 sessions.
Events Ahead This Week
- Mon Sep 14, 6:15 PM ET — ECB President Lagarde Speaks: EUR/USD direction affects dollar demand; any hawkish signal is a mild gold tailwind.
- Mon Sep 14, 3:30 PM ET — Canada CPI m/m (forecast –0.1%): Secondary USD/CAD impact; a soft print reduces CAD safe-haven competition for gold flows.
- Tue Sep 15 — FOMC Meeting Day 1: Deliberations begin; no statement released. Watch for any pre-meeting Fed communication leaks or commentary.
- Wed Sep 16, 2:00 PM ET — FOMC Rate Decision + SEP + Dot Plot (forecast: +25bp to 3.75–4.00%): The week’s defining event for gold. Hike priced in; dot plot and Warsh press conference tone at 2:30 PM ET are the true price drivers.
- Thu Sep 17 — Initial Jobless Claims + Philadelphia Fed Manufacturing Index: Labour data post-FOMC will determine whether the rate hike narrative extends or fades.
- Thu Sep 17 — FOMC-related Fed speaker appearances expected; watch for commentary on whether Wednesday’s decision is a pause or the start of a new cycle.
- Thu Sep 18 — August Industrial Production: Hard data release; a weak print would revive stagflation concerns and support gold.
For broader context on this week’s setup, see the Gold Week Ahead: Sep 14–18, 2026 — FOMC Decides at the $4,290 Floor and Friday’s Gold at $4,339 Eyes $4,370 Breakout Ahead of US CPI analysis.
London Session Update
Price Check
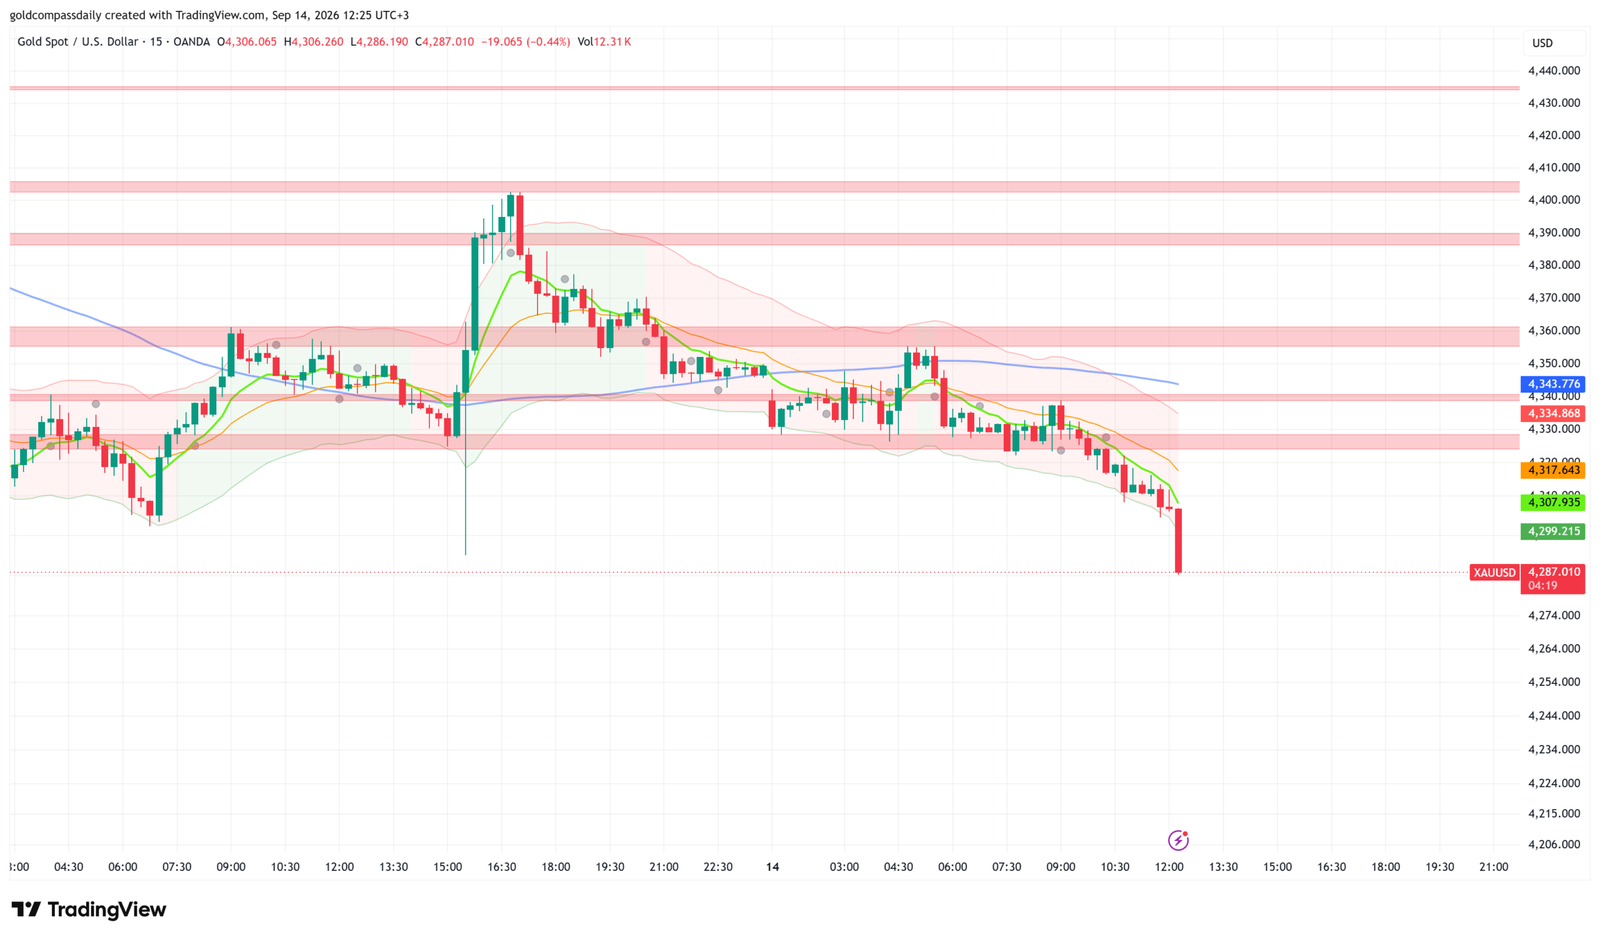
Gold Compass Daily’s morning analysis projected a cautiously bullish session with price holding above the $4,316–$4,325 support band and targeting $4,351 on a clean break of the $4,340 resistance. That thesis has been invalidated. Price has collapsed $44 from the morning open of $4,331, printing an intraday low of $4,286.19 at 12:25 UTC+3, breaking through every support level identified in the morning framework and triggering the Head-and-Shoulders invalidation signal below $4,282 flagged earlier.
What Changed
The $4,340 resistance zone — identified in the morning as the critical ceiling — was never breached to the upside. Instead, London session selling pressure accelerated through the $4,316 and $4,300 levels in rapid succession, consistent with pre-FOMC institutional de-risking and dollar bid strengthening ahead of Wednesday’s near-certain rate hike. The sharp vertical candle visible at 12:00 UTC+3 — dropping approximately $45 in under 15 minutes — carries the signature of a stop-cascade through the $4,299 level, likely triggering resting sell stops below the weekly $4,282 floor. Volume confirmation is visible on the chart (12.31K versus the morning’s 7.26K), indicating institutional participation in the move rather than thin-market noise. The catalyst for acceleration may be tied to broader USD strength as FOMC blackout period positions are being established, though no high-impact U.S. data releases have yet printed today. The move has now closed below the horizontal dotted support line visible near $4,299, which previously held as the weekly structural floor.
Updated Levels
- Current price: $4,287
- Bias now: Changed — Bearish. Morning bullish bias is invalidated. Price has broken below the $4,282 Head-and-Shoulders neckline, shifting the structural bias to bearish until a confirmed close back above $4,299.
- Updated support: $4,282 (now acting as overhead resistance) → $4,260 (measured H&S target zone) → $4,206 (chart base)
- Updated resistance: $4,299 (dotted structural floor, now flipped to resistance) → $4,308 → $4,318–$4,330
- London session target: $4,260–$4,265 if $4,282 fails to recapture on the next 15-minute close
Scenarios into the NY Handoff
Bull: Price recaptures $4,299 on a 15-minute close with volume — squeeze potential back toward $4,318, but structural damage limits upside to $4,330 before the NY open. Bear: Rejection at $4,299–$4,308 and continuation below $4,282 opens the measured H&S target at $4,200–$4,210 ahead of Wednesday’s FOMC decision.
Chart Analysis
The updated 15-minute chart as of 12:25 UTC+3 on September 14 tells a structurally different story than the morning session. Price has broken cleanly below the horizontal dotted support near $4,299 — the level that defined the weekly floor — in a single aggressive candle to $4,286, leaving a visible gap-style impulse and no consolidation base at the breakdown point. All short-term moving averages (green and orange lines) are steeply declining and have crossed below the longer blue moving average, confirming a momentum shift to bearish across all tracked timeframes. The Bollinger Band lower boundary has expanded sharply, signalling elevated volatility and a trending condition rather than a mean-reversion setup. The resistance cluster annotated on the right side of the chart — $4,299.215, $4,307.935, $4,317.643, $4,334.868, and $4,343.776 — now forms a layered overhead structure that buyers must work through sequentially. The measured move from the Head-and-Shoulders pattern (neckline at $4,282, head at $4,405) projects a target toward $4,159–$4,200, though the initial session target remains $4,260 where a natural demand cluster may emerge ahead of Wednesday’s FOMC. The bias is bearish below $4,299.
New York Session Update
Price Check
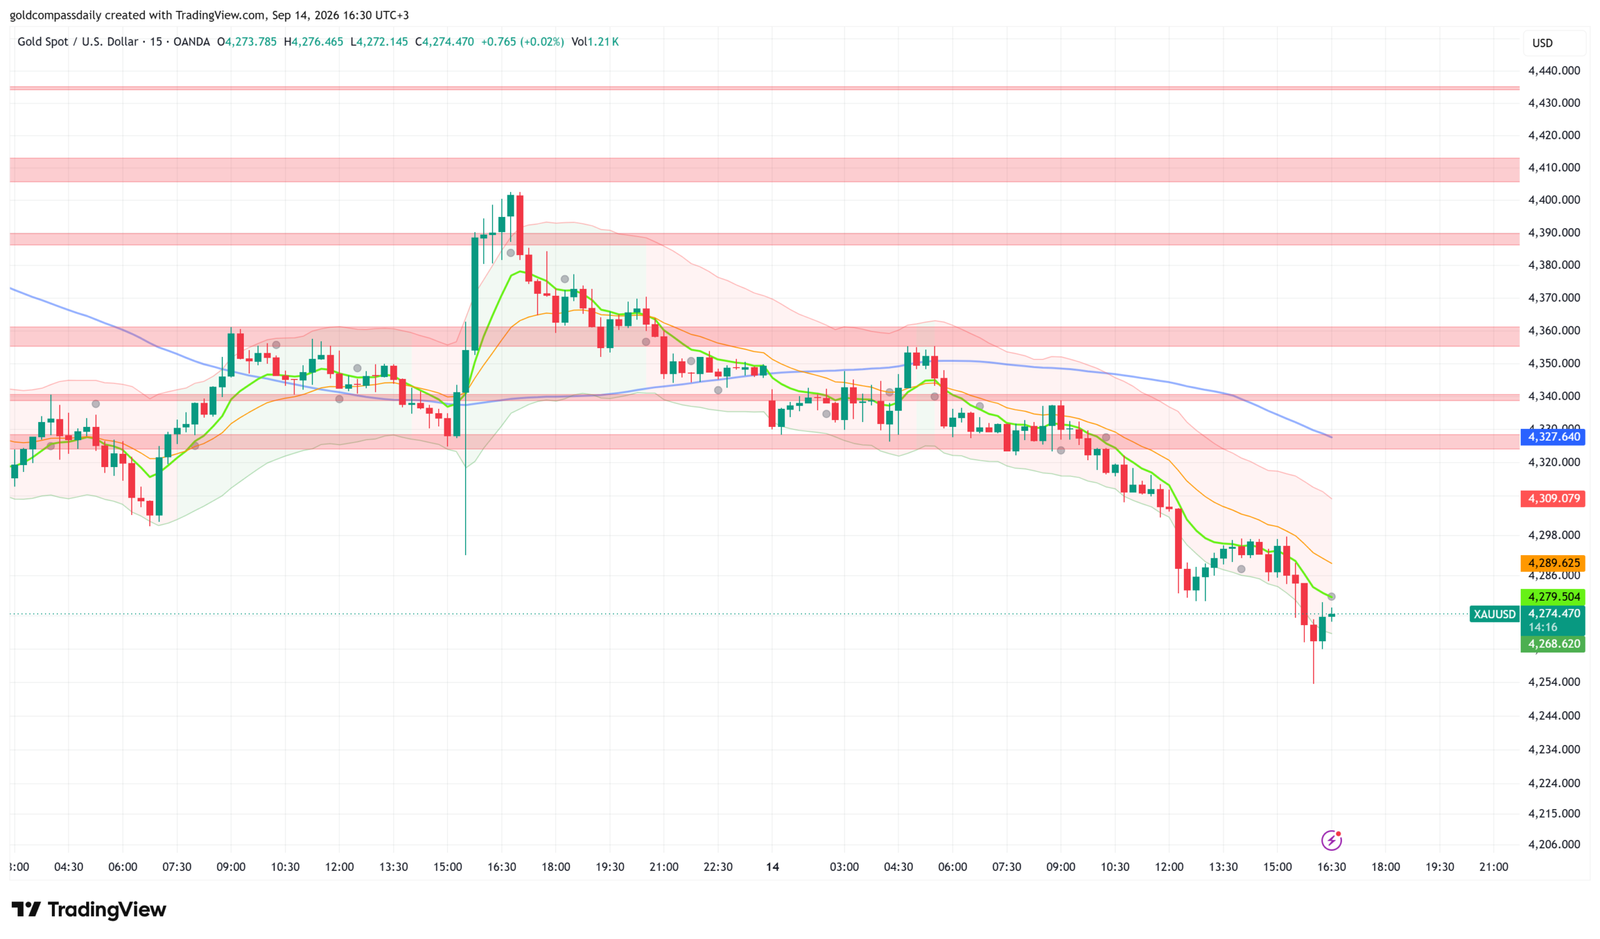
Gold has extended its decline to $4,274, adding another $13 of losses since the London session update and now trading $57 below the morning open of $4,331. The morning bullish thesis is fully invalidated, and the London session bearish pivot has been confirmed — price has found no meaningful bid at any level identified in either prior update.
What Changed
The London session breakdown below $4,282 was not absorbed — it was followed through. The NY open brought a second leg lower, with price printing a session low of $4,268.62 at 14:16 UTC+3 before staging a fractional recovery to current levels near $4,274. Volume has collapsed to 1.21K on the current candle cluster, indicating that the NY session is not attracting fresh buyers — this is low-conviction consolidation at the lows, not a base-building structure. Canada’s August CPI data released at 3:30 PM ET came in at the forecast of –0.1% m/m, a benign print that offered no counter-narrative to dollar strength. ECB President Lagarde’s speech at 6:15 PM ET remains the only scheduled catalyst for the remainder of the session, but with EUR/USD already under pressure, any hawkish ECB tone would require a material surprise to reverse the USD bid that has driven gold’s 2.3% intraday decline. The dominant force remains pre-FOMC dollar positioning ahead of Wednesday’s near-certain rate hike.
Updated Levels
- Current price: $4,274
- Bias now: Bearish — confirmed and extended. No structural floor has formed since the $4,282 neckline breach. Trend is intact to the downside.
- Updated support: $4,268 (session low, first defence) → $4,254 → $4,206 (chart base)
- Updated resistance: $4,279–$4,286 (active rejection zone) → $4,289 → $4,309
- NY session target: $4,254–$4,260 on a break below $4,268 with any volume pickup
Scenarios into the Close
Bull: A 30-minute close above $4,289 with expanding volume triggers a short-cover squeeze toward $4,309, though the broader structure remains bearish and any recovery is likely a sell-into opportunity ahead of FOMC. Bear: A break and close below $4,268 on the NY afternoon session confirms continuation toward $4,254 and opens the measured H&S target range of $4,200–$4,210 as the pre-FOMC destination.
Chart Analysis
The 15-minute chart as of 16:30 UTC+3 shows XAU/USD at $4,274.47, printing a tight consolidation cluster directly at the session lows after the sharp two-candle flush to $4,268 at 14:16 UTC+3. Price is well below all visible moving averages — the green short-term MA, the orange medium MA, and the blue long-period MA are all stacked bearishly and declining in sequence, the most structurally bearish MA configuration visible on this chart across the entire two-session period. The Bollinger Band lower boundary has expanded and price is hugging it, consistent with a sustained trending move rather than an overextended spike due for mean reversion. The annotated resistance levels on the right side of the chart — $4,268.62 (session low), $4,279.504, $4,289.625, $4,309.079, and $4,327.640 — now form a complete overhead structure; each level must be reclaimed sequentially before any bullish case can be made. The dotted horizontal line near $4,286 — previously the weekly structural floor and morning support — is now acting as the ceiling of the current consolidation range, with price failing to close above it on every attempt since the breakdown. The projected path, absent a catalyst, is a continuation grind toward $4,254 through the NY afternoon before potential stabilisation ahead of the Asian open.
New York Close & Asian Session Outlook
NY Close
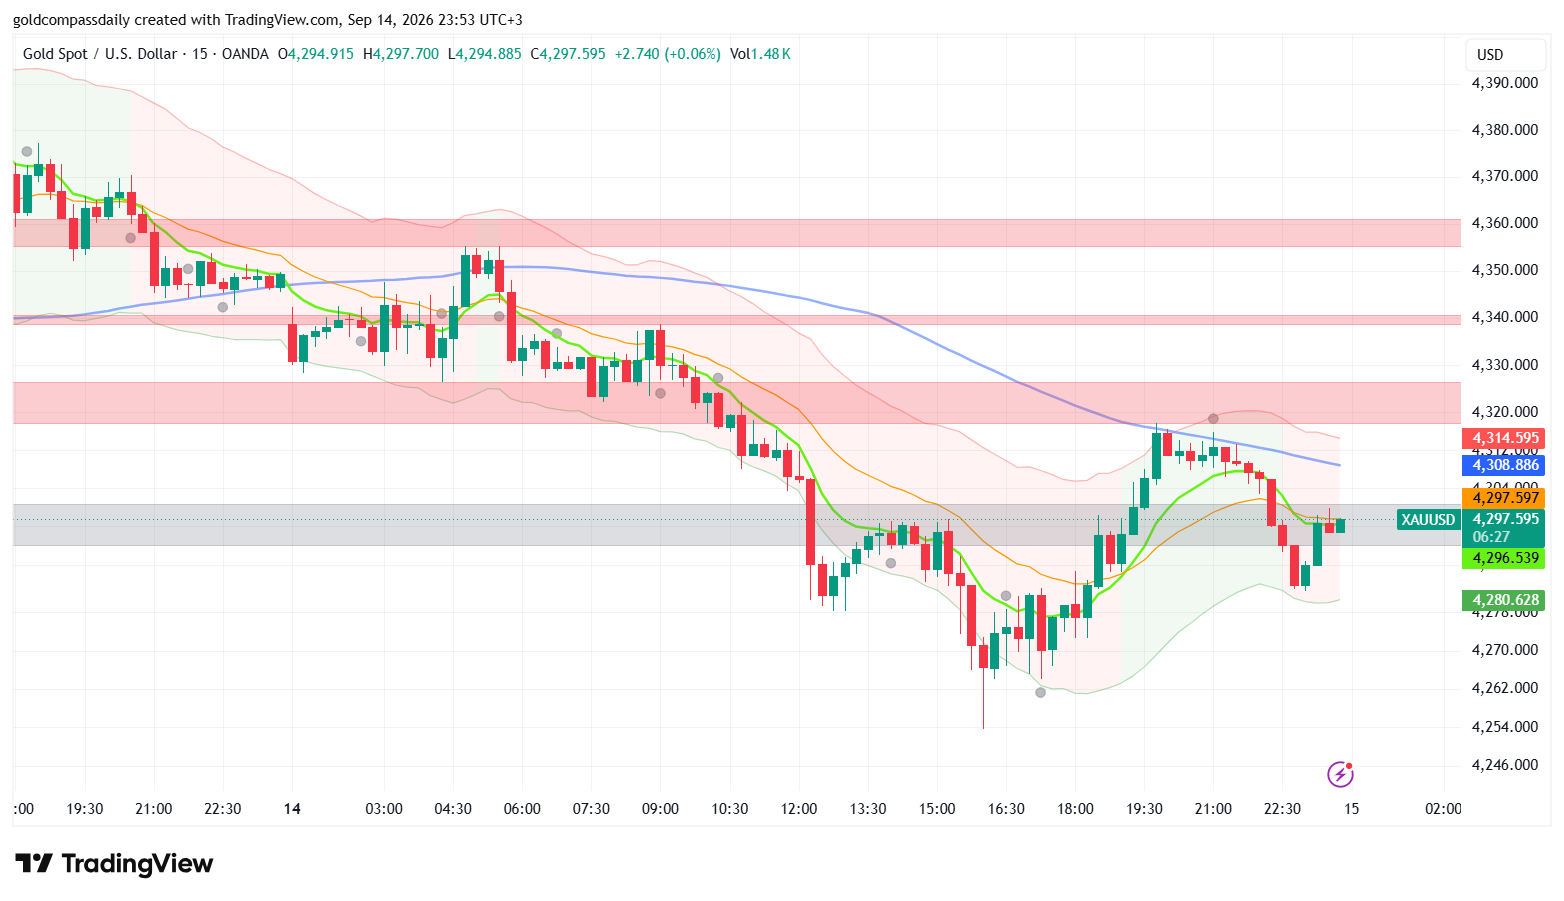
Gold closed the New York session at $4,297.60 — bearish — confirming the full invalidation of Gold Compass Daily’s morning bullish thesis and extending the day’s total decline to $33.40 from the $4,331 open. The metal staged a partial recovery from the intraday low of $4,254.88 printed at approximately 16:00 UTC+3, but the close below $4,300 leaves the structural bias firmly in seller territory heading into the Asian session. Monday’s trading range of roughly $120 — from the early spike high near $4,405 to the $4,254 low — underscores the scale of the pre-FOMC repositioning that defined the session.
Updated Key Levels
- NY Close: $4,297.60
- Session high: $4,297.70 / Session low: $4,254.88
- Bias into Asian session: Bearish below $4,309 | Neutral between $4,280–$4,309
- Asian session support: $4,280.63 (green demand floor) → $4,254 (NY session low)
- Asian session resistance: $4,304 → $4,309 → $4,314.60
Chart Read at Close
The 15-minute chart as of 23:53 UTC+3 shows price at $4,297.60, sitting inside the grey consolidation band between approximately $4,278 and $4,300 that formed during the NY afternoon recovery. The green short-term moving average has begun curling upward from the $4,280 demand zone, while the orange medium MA remains above price near $4,308 — acting as a dynamic resistance cap on any recovery attempt. The blue long-period MA continues its steep descent from $4,340, confirming the broader bearish trend structure is intact. The Bollinger Band lower boundary has begun contracting from its maximum expansion during the $4,254 flush, suggesting volatility compression into the Asian session — consistent with a range-bound rather than directional overnight. The closing candle structure shows a small-bodied doji cluster near $4,297, indicating equilibrium between buyers and sellers at the close with neither side in decisive control. The green demand zone boundary sits at $4,280.63, and price has so far respected it as a floor on the NY recovery leg.
Asian Session Outlook
The Asian session (00:00–09:00 UTC+3) is expected to be range-bound between $4,280 and $4,309, with low directional conviction given the absence of tier-one Asia-Pacific data releases on Tuesday’s calendar. The most probable behaviour is a liquidity sweep — either a dip toward the $4,278–$4,280 green demand floor to collect sell-side stops before a recovery, or a grind toward $4,309–$4,314 to test the orange MA resistance before renewed selling. A clean break below $4,278 during the Asian session would signal that the NY recovery is exhausted and project continuation toward $4,254 before the London open. Thin volume conditions (current candle at 1.48K) support the range-bound thesis. Watch the $4,280 level as the key pivot — it defines the entire Asian session directional bias.
Next Day Bull / Bear Scenarios
Bull trigger: Asian session holds $4,280 and London open produces a 30-minute close above $4,314 → targets $4,327–$4,340 resistance cluster. Requires a catalyst such as a soft USD print or risk-on shift to sustain.
Bear trigger: Failure to hold $4,280 during Asian session or London open rejection at $4,309 → continuation toward $4,254 and the measured H&S target range of $4,200–$4,210 ahead of Wednesday’s FOMC decision.
Tuesday’s Key Events
- All day — FOMC Meeting Day 1 (deliberations begin, no statement): Institutional desks will manage risk exposure; any pre-meeting Fed communication or leak would be an immediate gold mover.
- 15:30 UTC+3 — U.S. Empire State Manufacturing Index (September, forecast varies): Weak print reinforces stagflation narrative — mild gold tailwind. Strong print extends USD bid.
- 15:30 UTC+3 — U.S. Retail Sales m/m (August, forecast ~0.3%): Strong consumer data reduces the Fed’s motivation to pause after Wednesday’s expected hike — bearish for gold. Miss extends the recovery from $4,254.
- 16:15 UTC+3 — U.S. Industrial Production m/m (August): Hard activity data; a miss combined with weak retail sales would revive stagflation pricing and support gold toward $4,327.
- 17:00 UTC+3 — U.S. Business Inventories: Secondary data, minimal direct gold impact unless significantly off-forecast.
Analysis based on the XAU/USD 15-minute chart as of September 14, 2026, 09:07 UTC+3. This article is for informational and educational purposes only and does not constitute financial advice.