

Gold trades cautiously bullish at $4,339 — recovering from overnight lows near $4,305, but capped below the $4,340–$4,345 zone ahead of the August US Consumer Price Index print, which lands at 3:30 PM UTC and carries direct implications for whether the Federal Reserve hikes rates at its September 16 meeting. The chart structure favors a continuation move toward $4,370–$4,380 if CPI data comes in softer than the 3.4% consensus. A hot print risks reversing the morning recovery entirely.
Key Levels
- Bias: Cautiously Bullish above $4,325 — bearish on a close below
- Support: $4,325 → $4,305 (session low / structural demand)
- Resistance: $4,340–$4,345 (immediate ceiling) → $4,370–$4,380 (supply zone) → $4,400 (major resistance band)
- Session target: $4,370–$4,380 (conditional on CPI ≤ 3.3% or Core ≤ 0.2% m/m)
- Invalidation: Below $4,305 = bullish structure fails; exposes $4,280 and deeper correction
Catalyst of the Day: August US CPI — 3:30 PM UTC
The August Consumer Price Index is the single most important event of this session and arguably of this week. Consensus calls for headline CPI at 3.4% year-over-year (unchanged from July) and 0.4% month-over-month, with core CPI forecast at 2.4% annually and 0.2% monthly. Gold Compass Daily notes the critical context: markets are currently pricing roughly 60–63% odds of a 25-basis-point Federal Reserve rate hike at the September 16 meeting, following yesterday’s hotter-than-expected August PPI reading of 5.4% annually (forecast: 5.3%). If today’s CPI comes in at or above consensus, those hike odds could push toward 70–75%, strengthening the US dollar and real yields — both headwinds for non-yielding gold. A softer print — particularly core at 0.1% m/m or headline at 3.3% — would mechanically pressure the dollar, pull back yield expectations, and unlock the next leg higher for XAU/USD. Watch the 3:30 PM UTC timestamp: gold’s 15-minute candle at that moment will determine whether the $4,340–$4,345 ceiling breaks or acts as a rejection point for the remainder of the session.
Fundamental Context
The macro backdrop for gold remains caught between two opposing forces. On the bullish side, central bank demand is structurally robust: the World Gold Council reported net purchases of 288.9 tonnes in Q2 2026 — a 62% year-over-year increase and the strongest second quarter on record. Geopolitical risk, including the ongoing Strait of Hormuz crisis, continues to sustain a risk premium in the gold price. Institutional year-end targets remain elevated, with Goldman Sachs projecting $4,900 and JPMorgan at $4,500 by Q4. These factors explain why gold has retained the $4,300 handle despite meaningful Fed tightening pressure.
On the bearish side, the Federal Reserve’s policy path is the clearest near-term headwind. The July FOMC meeting produced a 9-3 vote to hold rates at 3.50–3.75%, but three dissenters favored an immediate hike — a signal that the September 16 meeting is live and contested. Chairman Kevin Warsh’s Jackson Hole remarks reinforced a hawkish disposition, noting “concerning” inflation levels well above the Fed’s 2% target. Yesterday’s PPI at 5.4% annually strengthened the hawks’ argument ahead of today’s CPI. For gold, every additional basis point of expected tightening is a direct headwind: higher real yields increase the opportunity cost of holding a non-yielding asset, while a stronger dollar makes dollar-priced gold more expensive for global buyers. Today’s CPI print will either confirm or begin to unwind that pressure into the weekend.
The University of Michigan’s preliminary September Consumer Sentiment and Inflation Expectations readings — due at 5:00 PM UTC — carry secondary importance. A jump in the 1-year inflation expectations gauge above the prior 4.0% reading would compound the hawkish narrative and extend downward pressure on gold. SNB Chairman Schlegel’s speech at 12:15 PM UTC and ECB President Lagarde’s remarks at 5:00 PM UTC are also in the pipeline; any shift in European central bank rhetoric toward further tightening would broadly pressure precious metals by firming global real yield expectations.
Chart Analysis
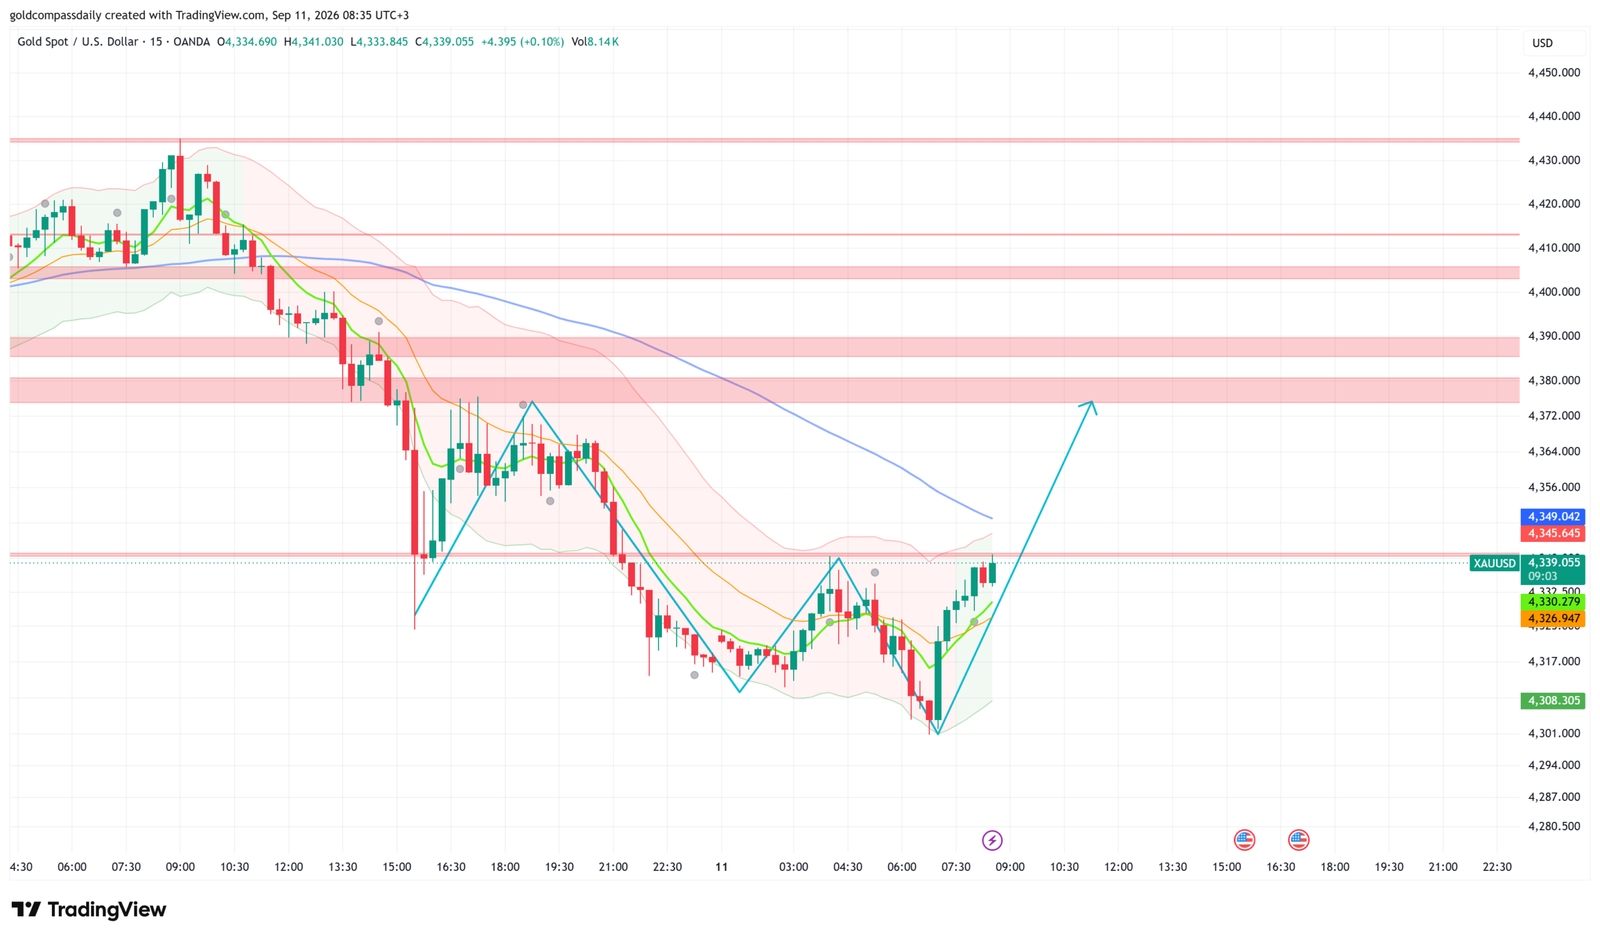
The 15-minute XAU/USD chart (OANDA, as of 09:03 UTC) shows a clear recovery structure forming after the overnight session low near $4,305. Price is now testing the $4,339–$4,345 zone, which aligns with a cluster of dynamic resistance: the descending green short-term moving average and the lower boundary of a prior consolidation range from early September 11. The Bollinger Band envelope remains wide and angled downward, confirming the dominant intraday trend is still corrective from the $4,430+ peak seen earlier in the week. However, the most recent price action shows a clear V-shaped reversal from the $4,305 low, with bullish momentum (larger green candles with follow-through) indicating buyers are active at the current level. The drawn projected path on the chart points toward the $4,370–$4,380 resistance band — consistent with the upper red horizontal zone visible on the chart — if the $4,345 ceiling gives way. The key moving averages (green and orange on the 15-minute) remain in a bearish slope but are converging, suggesting the short-term downtrend is losing momentum. A close above $4,345 on elevated volume would shift the immediate bias to constructive. Until then, the $4,340–$4,345 zone remains the fulcrum of the session.
Bull / Bear Scenarios
Bull Trigger
Condition: August CPI prints at 3.3% y/y or below, or core m/m at 0.1% — Fed hike odds fall below 50%, US dollar weakens.
Action: A 15-minute close above $4,345 on rising volume confirms the breakout.
Target: $4,370 (first objective) → $4,380 (session high target) → $4,400 on extended momentum.
Bear Trigger
Condition: August CPI at 3.5% y/y or above, or core m/m at 0.3% — Fed hike probability pushes toward 70%+, dollar strengthens, real yields rise.
Action: A 15-minute close below $4,325 confirms the recovery has failed.
Target: $4,305 re-test → $4,280 if the structural low breaks on follow-through selling.
Events Ahead
- Today, 12:15 PM UTC — SNB Chairman Schlegel Speaks: Any hawkish surprise would strengthen CHF and signal broader G10 central bank tightening bias — marginally negative for gold.
- Today, 3:30 PM UTC — US CPI m/m & y/y (forecast: 0.4% / 3.4%); Core CPI m/m & y/y (forecast: 0.2% / 2.4%): The session’s primary catalyst. A miss or beat of 0.1 percentage points in either direction will move XAU/USD by $20–$40 within minutes.
- Today, 5:00 PM UTC — ECB President Lagarde Speaks; UoM Consumer Sentiment (forecast: 51.0) & Inflation Expectations (prior: 4.0%): Secondary catalysts. Elevated UoM inflation expectations extend the hawkish narrative for the Fed; Lagarde’s tone influences EUR/USD and indirectly gold’s dollar relationship.
- Today, 9:00 PM UTC — US Federal Budget Balance (forecast: -$221.1B): Low direct impact on gold; confirms fiscal trajectory but rarely moves spot prices intraday.
- Monday, September 14 — Markets begin positioning for the September 15–16 FOMC meeting. Any weekend geopolitical developments involving the Strait of Hormuz could add a safe-haven gap at the open.
- Tuesday, September 16 — Federal Reserve Rate Decision: The week’s dominant event for gold. A 25 bps hike would push real yields higher and pressure XAU/USD toward $4,280–$4,300 unless the statement signals a clear pause thereafter. A hold would likely ignite a sharp rally toward $4,420+.
For broader context on this week’s macro calendar and its implications for gold, see the Gold Week Ahead: Sep 7–11 — US CPI & ECB Rate Decision in Focus. Yesterday’s session analysis is available at Gold Tests $4,420 Resistance — ECB Rate Decision and US PPI in Focus.
With CPI due in approximately six hours, gold is holding above the key $4,325 structural floor and attempting to reclaim the $4,345 breakout level. The data does not yet exist to confirm the bullish scenario — traders should treat the current level as a pre-event holding pattern rather than an established trend. A confirmed close above $4,345 pre-CPI would signal institutional accumulation ahead of the print; a failure to hold $4,325 pre-CPI would signal early distribution and risk of a sharper selloff on any hawkish data surprise.
h2>London Session UpdatePrice Check
Gold is trading at $4,348–$4,349 at the time of this update (13:34 UTC), having recovered from the overnight session low of $4,300 and now pressing against the $4,350 level that Gold Compass Daily’s morning analysis identified as the immediate resistance ceiling. The morning’s cautiously bullish bias at $4,339 has held directionally — price pushed higher — but has not yet converted into a confirmed breakout, as $4,350 continues to act as a rejection point.
What Changed
Two developments since the morning analysis have materially shifted the macro backdrop. First, the ECB’s September 10 meeting delivered a hawkish surprise beyond the expected 25-basis-point hike to 2.50%: Lagarde characterised the decision as a unanimous “no-brainer” and left the door wide open for further hikes in October and December, stating that inflation was “set to remain well above target for an extended period.” While the euro’s reaction was muted — EUR/USD dipped back toward $1.16 as Lagarde declined to pre-commit to a rate path, with the hawkish inflation forecast upgrade partially neutralised by growth concerns — the broader signal for gold is unambiguously negative: a global central bank tightening cycle, not a pivot, is the operating environment. Second, Fed hike probability for the September 16 meeting has risen to 72% following yesterday’s PPI data, as markets increasingly interpret the inflation backdrop as sufficient to prompt tightening at the next FOMC meeting. That combination — ECB hiking with forward guidance, Fed at 72% hike odds — makes this afternoon’s US CPI print the single remaining variable that can either confirm or disrupt gold’s attempt to reclaim $4,380.
:antCitation[]{citations=”761986d0-b40e-42c5-bdec-5884245001de”}Updated Levels
- Current price: $4,349
- Bias now: Cautiously Bullish — unchanged above $4,329, but more conditional than this morning given elevated Fed hike probability
- Updated support: $4,339 (100-day SMA / former morning resistance now acting as floor) → $4,305 (session low / structural demand)
- Updated resistance: $4,350–$4,352 (current ceiling, multiple rejection wicks) → $4,376–$4,384 (supply band, chart projection target) → $4,392–$4,400 (major resistance zone)
- London session target: $4,376–$4,384 on a confirmed 15-minute close above $4,352 with CPI ≤ 3.3% y/y
Scenarios into the NY Handoff
Bull: August CPI prints at or below 3.3% y/y or core m/m at 0.1% → 15-minute close above $4,352 confirms breakout → target $4,376–$4,384 into the NY session close. Bear: CPI at or above 3.5% y/y or core m/m at 0.3% → rejection at $4,350 and a 15-minute close below $4,329 re-opens $4,305, with $4,282 exposed on follow-through selling.
Chart Analysis
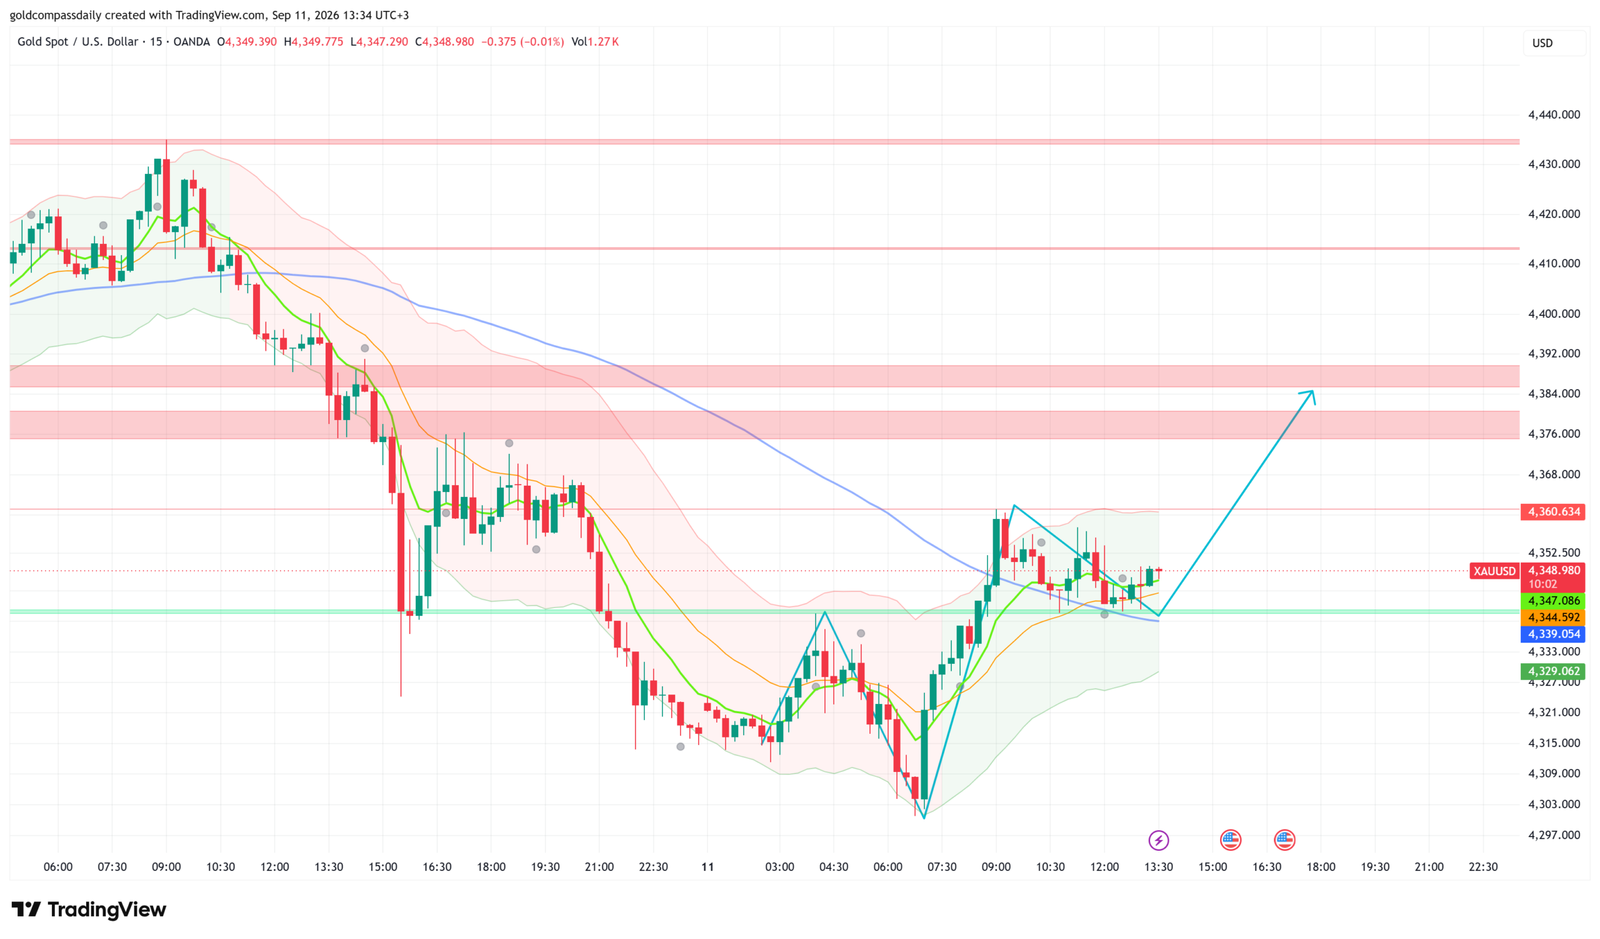
The updated 15-minute chart (OANDA, 13:34 UTC) confirms the V-shaped recovery from the $4,300–$4,304 session low is intact, with price now consolidating in a tight range between $4,344 and $4,360. The green short-term moving average has crossed back above the orange medium-term MA — a bullish cross on the 15-minute timeframe — and the Bollinger Band has begun to contract and flatten, signalling a reduction in downward momentum and a potential coiling structure ahead of the CPI catalyst. The key observation is that price is pressing against the underside of the $4,349–$4,352 zone, which aligns with the red dotted resistance line visible on the chart. The drawn projected path extends toward the $4,376–$4,384 supply band, consistent with the upper red horizontal zone on the chart — this remains the first meaningful upside target if the current ceiling breaks. Volume is light at 1.27K (versus 8.14K at the morning open), confirming the market is in a holding pattern rather than trending. The structure favours the bull scenario into CPI, but the absence of a confirmed breakout above $4,352 means the trade is not yet validated.
New York Session Update
Price Check
Gold Compass Daily’s morning analysis projected a session target of $4,370–$4,380 on a soft CPI print. The actual CPI delivered a mixed result — and gold’s market reaction has exceeded the morning’s bull scenario target, with XAU/USD surging to a session high of $4,394.51 before pulling back to $4,394 at the time of this update. The morning’s bullish bias has been fully validated.
What Changed
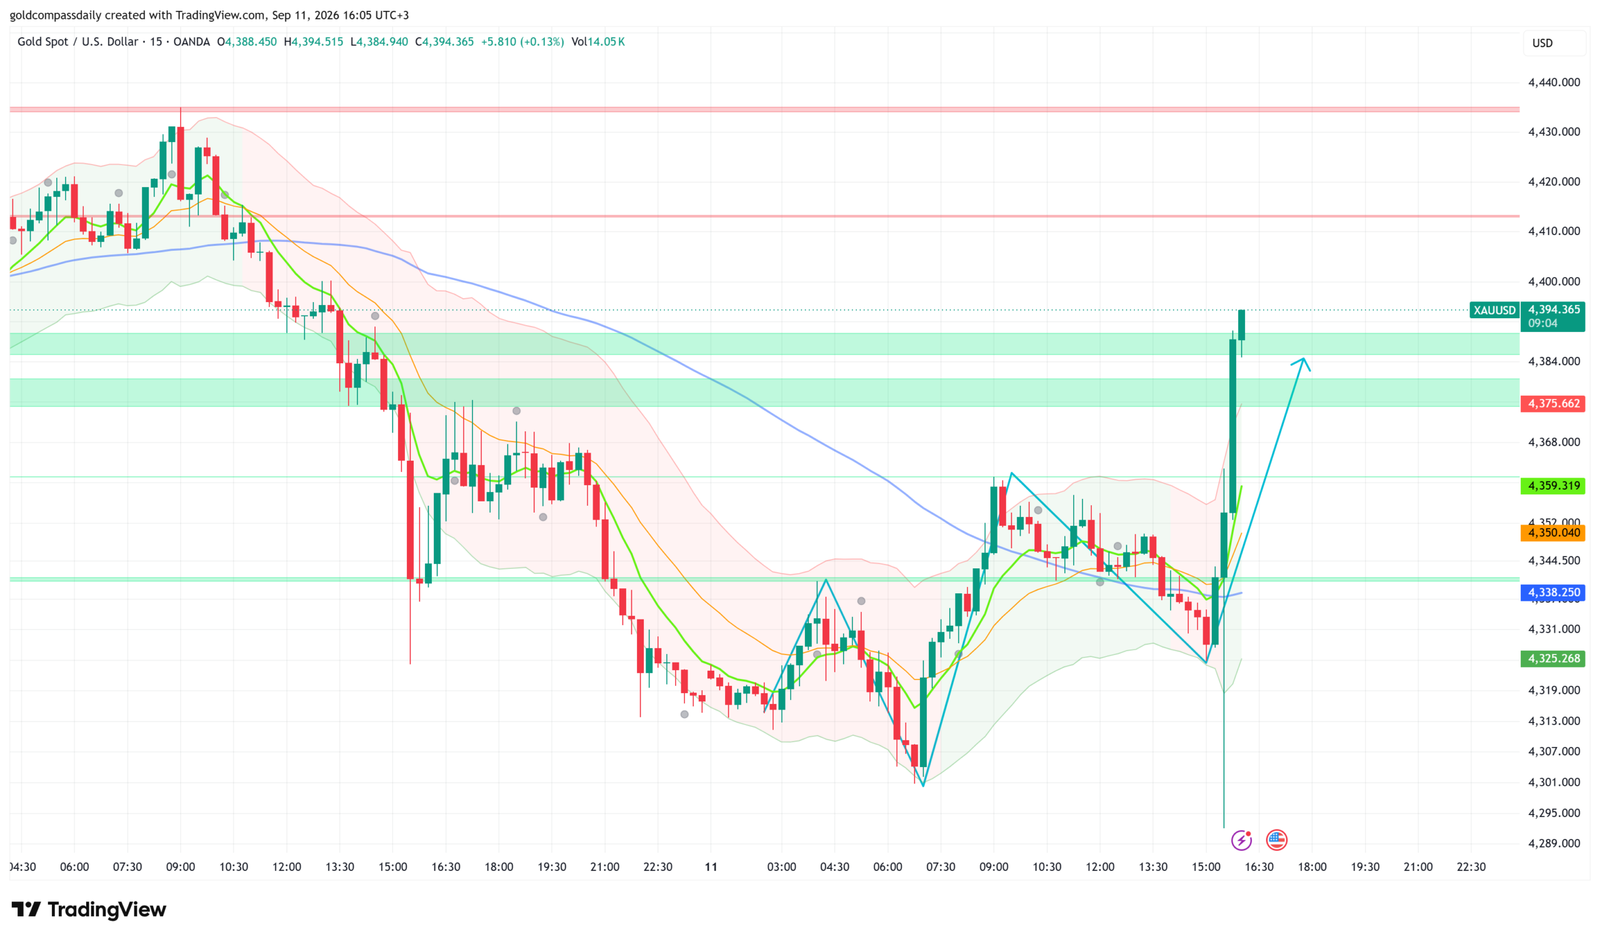
The August CPI print landed at 8:30 AM ET (15:30 UTC) and delivered a split verdict: headline CPI printed in line with consensus at 3.4% year-over-year and 0.4% month-over-month, while core CPI surprised to the upside at 0.3% m/m — one-tenth of a percentage point above the 0.2% forecast — though the annual core rate held at 2.4% as expected. Gasoline prices drove the headline acceleration, rising 3.9% on the month and accounting for more than a third of the total index gain. The market’s initial reaction was a sharp sell-off — visible on the chart as the dip to approximately $4,325 — as traders processed the hot core monthly print. That sell-off was then violently reversed: the market repriced quickly as participants concluded the core overshoot was energy-adjacent rather than broad-based, and that the Fed’s September 16 decision remained genuinely uncertain rather than a confirmed hike. The result was a $69 spike from $4,325 to $4,394 within a single 15-minute candle — a move consistent with short-covering from traders who had positioned bearishly into the print, combined with fresh longs entering on the thesis that the Fed may still opt to hold next week.
Updated Levels
- Current price: $4,394
- Bias now: Bullish — upgraded from cautiously bullish; the CPI reaction has structurally shifted short-term momentum to the upside
- Updated support: $4,375 (first pullback zone / green horizontal band on chart) → $4,350–$4,352 (former ceiling, now structural floor) → $4,338 (100-day SMA)
- Updated resistance: $4,395–$4,400 (current ceiling, visible on chart as the red dotted line) → $4,410 → $4,430 (weekly high / major supply zone)
- NY session target: $4,410–$4,420 on a confirmed 15-minute close above $4,400
Scenarios into the Close
Bull: A 15-minute close above $4,400 on sustained volume confirms breakout continuation → target $4,410–$4,420 into the NY close, with $4,430 the weekly high objective. Bear: Failure to hold $4,375 on a pullback — particularly if UoM inflation expectations print above 4.1% at 17:00 UTC — opens a retest of $4,350–$4,352 and potential fade of the entire CPI spike.
Chart Analysis
The 15-minute chart (OANDA, 16:05 UTC) tells a clear post-CPI story. The pre-release consolidation between $4,344 and $4,360 collapsed briefly to $4,325 — matching the lower green support band visible on the chart — before a near-vertical spike carried price to $4,394.51, the session high. The move punched through every resistance level identified in the morning and London updates in a single candle. Price is now consolidating just below the red dotted resistance line at approximately $4,395–$4,400, with the green and orange moving averages both turning sharply higher following the spike, confirming momentum has shifted decisively bullish on the 15-minute timeframe. The Bollinger Band has expanded violently upward, reflecting the breakout. The drawn projected path on the chart points toward $4,384 as the next consolidation zone — but given current price at $4,394, the more relevant near-term reference is the $4,400 ceiling visible as the upper red dotted line. The key support to watch on any pullback is the $4,375 green band, which must hold on a retest to keep the post-CPI structure intact. A close below $4,350 would invalidate the breakout entirely.
New York Close & Asian Session Outlook
NY Close
Gold closed the New York session at approximately $4,349 — neutral to mildly bullish — confirming the morning’s directional bias while surrendering the majority of the CPI-driven spike gains. Gold Compass Daily’s morning analysis projected a session target of $4,370–$4,380 and bull scenario of $4,410–$4,420 on a close above $4,400; price touched a session high of $4,400 precisely before reversing, validating the resistance call but failing to sustain the breakout. The close above $4,346 keeps the weekly structure bullish heading into FOMC week.
Updated Key Levels
- NY Close: $4,349
- Session high: $4,400 / Session low: ~$4,291 (CPI spike wick)
- Bias into Asian session: Cautiously Bullish above $4,335 — neutral below
- Asian session support: $4,346 (green demand band upper boundary) → $4,335 (green demand band lower boundary) → $4,308
- Asian session resistance: $4,370 (red supply zone base) → $4,384 → $4,400 (confirmed major ceiling)
Chart Read at Close
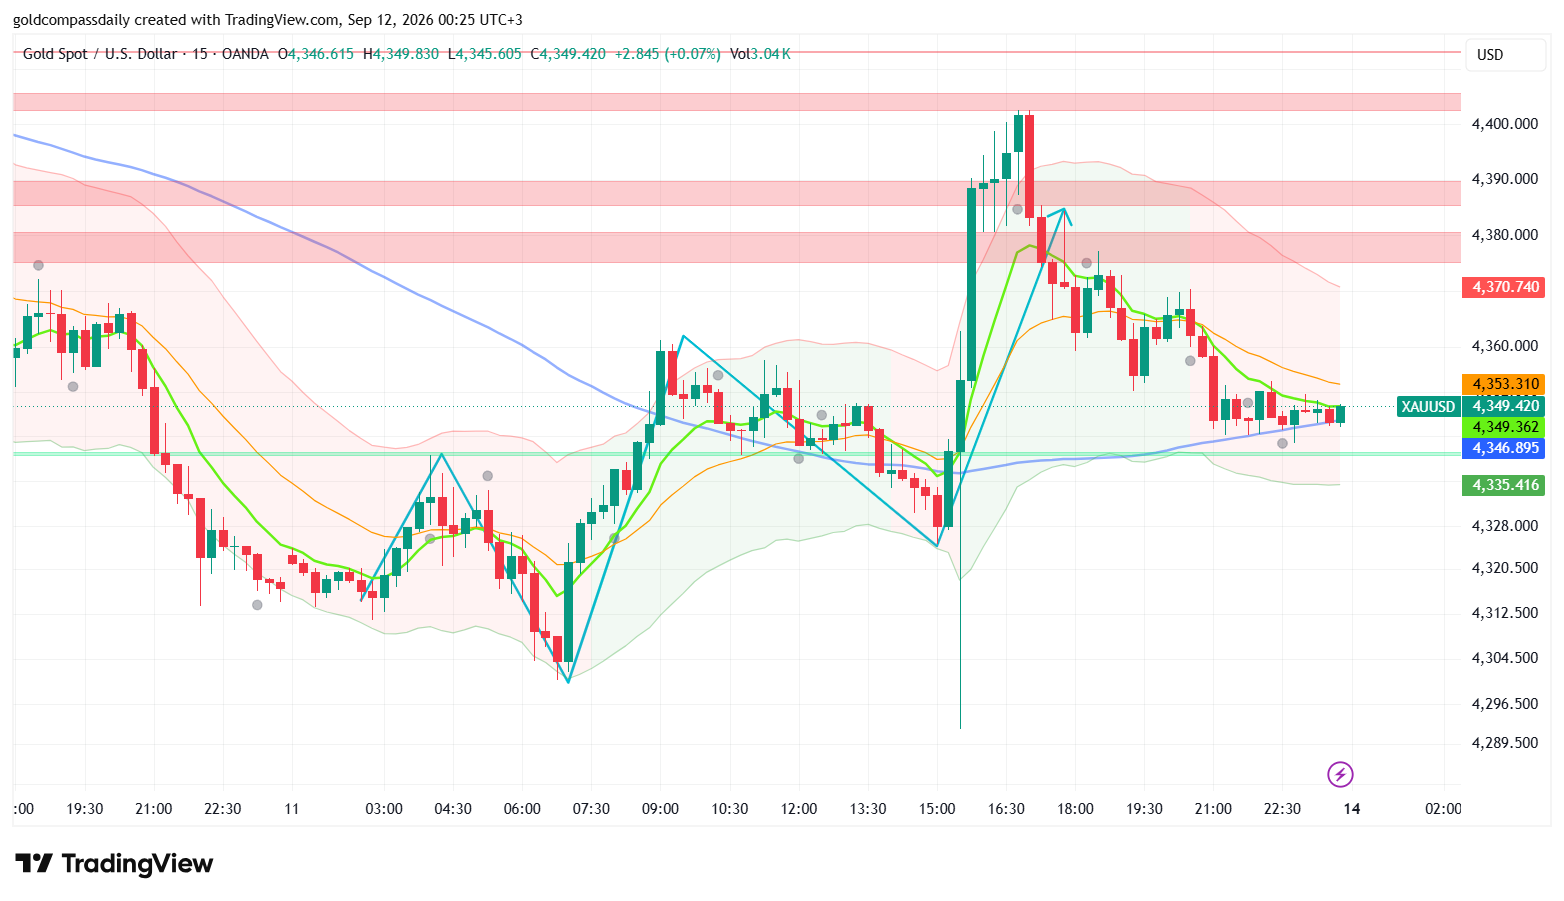
The 15-minute chart at the time of this update (00:25 UTC+3) shows gold consolidating directly on the upper boundary of the green demand zone between $4,346 and $4,335. Price is sandwiched between the converging green and blue long-term moving averages — with the green MA currently at $4,349 and the blue MA sloping down to meet it from above at approximately $4,353 — compressing the range and signalling indecision. The Bollinger Band has tightened considerably since the CPI spike, consistent with a post-event consolidation phase. Closing candle structure is neutral: small-bodied candles with wicks on both sides, confirming neither buyers nor sellers are in control at this level. The projected path arrow on the chart points modestly higher toward the $4,370–$4,384 zone, but the shallow angle of the projection reflects low conviction — a grind higher rather than another impulsive move.
Asian Session Outlook
With no major US data on Monday and China’s retail sales and industrial output due during the Asian session, the dominant theme overnight will be FOMC positioning rather than fresh catalysts. Asian session behaviour is most likely to be range-bound between $4,335 and $4,370, with a probable liquidity sweep of Friday’s NY close lows near $4,335–$4,338 before London opens — a common pattern ahead of high-impact central bank weeks as short-term traders probe stops below the consolidation zone. A clean hold of $4,346 on any overnight dip would be constructive; a break below $4,335 would suggest more corrective price action through Monday’s London session before the key FOMC events mid-week.
Monday Bull / Bear Scenarios
Bull trigger: Asian session holds $4,346, China macro data underwhelms (supporting risk-off / safe-haven demand) → London open builds toward $4,370 retest → target $4,384 into Monday close. Bear trigger: Overnight sweep breaks and closes below $4,335 → exposes $4,308 and signals pre-FOMC distribution; $4,280 comes into play if sellers accelerate ahead of Wednesday’s decision.
Monday’s Key Events
- All day — FOMC pre-meeting blackout period in effect: No Fed officials may speak; all rate expectations are now locked in until Wednesday’s decision, reducing macro noise but increasing sensitivity to any geopolitical headlines or position flows.
- 02:00 UTC+3 (Sunday night / Asia open) — China Retail Sales & Industrial Output (August): A miss on China data signals slowing global demand — historically supportive for gold as a safe-haven; a strong beat reduces safe-haven appetite marginally but is unlikely to shift the dominant FOMC narrative.
- Wednesday, September 16 — Federal Reserve Rate Decision (21:00 UTC+3): The week’s defining event. Markets are currently pricing approximately 70% probability of a 25 bps hike to 3.75–4.00%. A hold would likely drive a sharp rally toward $4,430+; a hike with hawkish guidance targets $4,280 and below.
Analysis based on the XAU/USD 15-minute chart as of September 11, 2026, 09:03 UTC. This article is for informational and educational purposes only and does not constitute financial advice.