

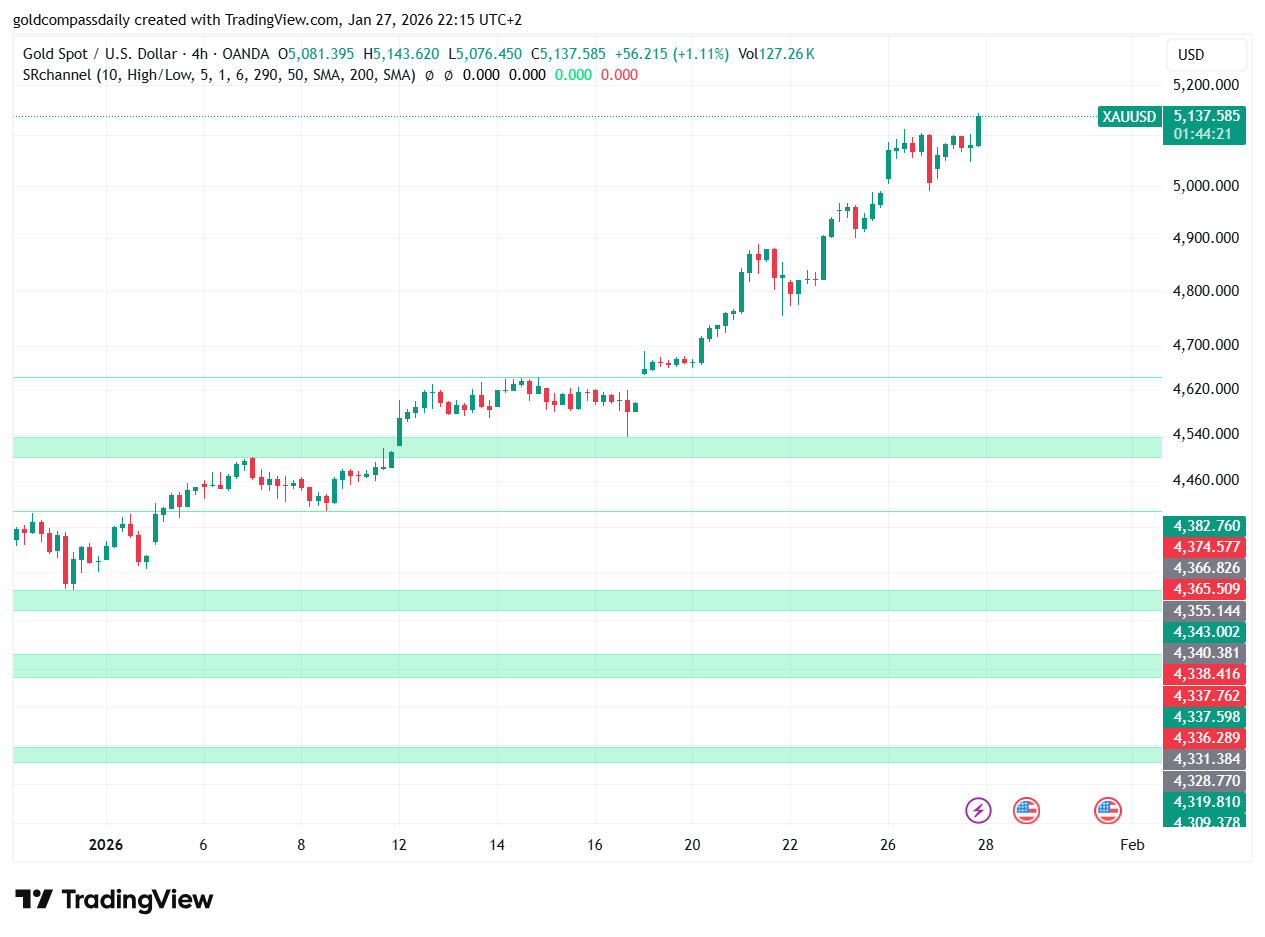
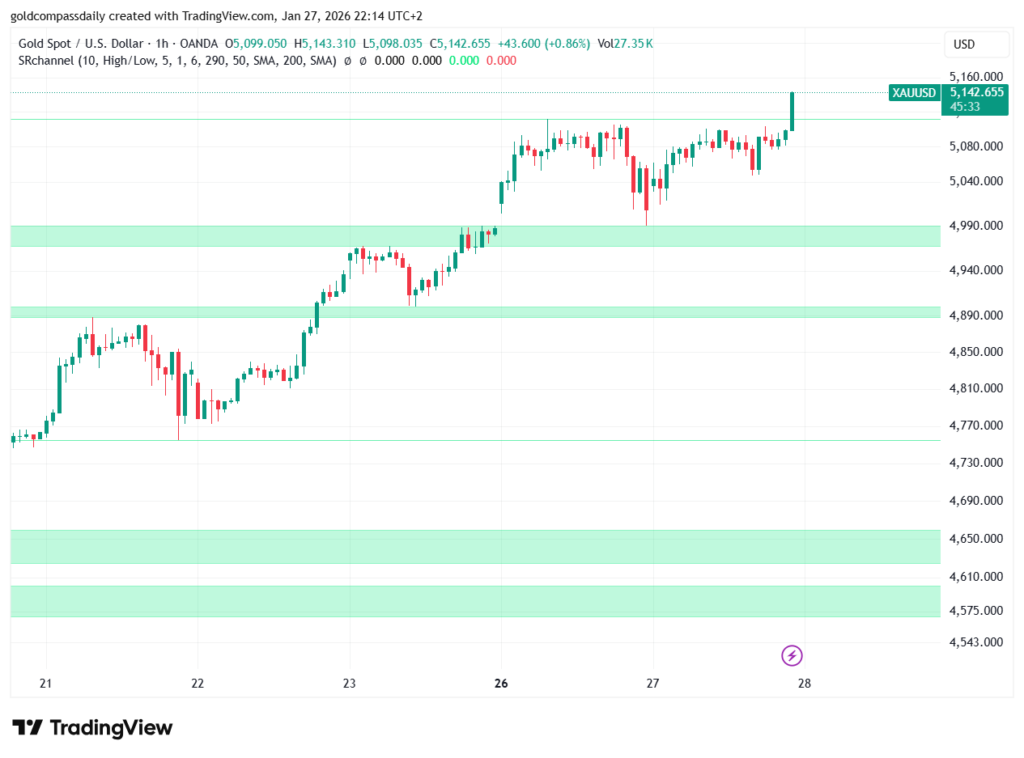
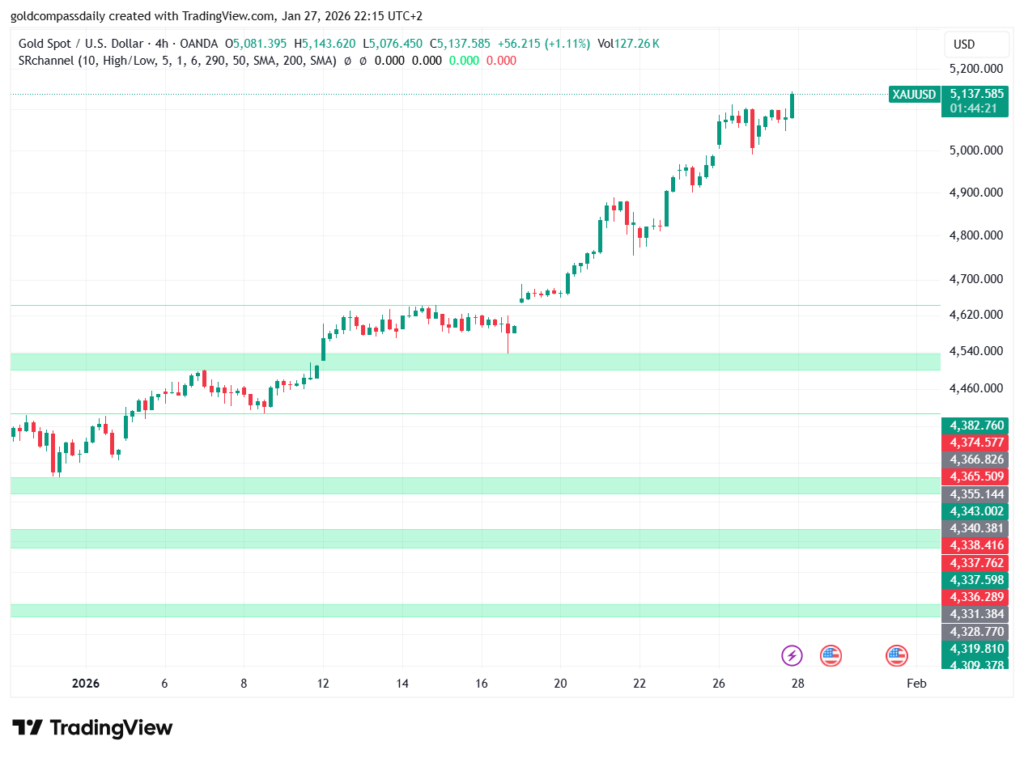
The gold market has reached a pivotal junction today, with massive volatility creating opportunities across all timeframes. In this Gold Technical Analysis XAU/USD summary, we consolidate our deep dives from the 5-minute, 1-hour, and 4-hour charts to give you the complete market picture.
Multi-Timeframe Gold Technical Analysis XAU/USD
To succeed in the current market environment, a trader must understand both the macro trend and the micro fluctuations. Our editorial team has prepared three distinct reports to help you navigate the surge toward $5,150.
1. The Macro View: 4-Hour Trend Confirmation
The foundation of our current bullish thesis lies in the major breakout above $5,130. This move signals a shift in institutional sentiment. For a detailed look at the long-term targets, read our Gold Price Analysis XAU/USD: Massive Breakout Above $5,130.
2. The Mid-Term Pulse: 1-Hour Intraday Momentum
As the price targets the psychological $5,150 barrier, the hourly chart shows how momentum is being sustained through the New York close. This Gold Technical Analysis XAU/USD segment is essential for swing traders. Check it out here: XAU/USD Intraday Analysis: Gold Targets $5,150 After 1H Surge.
3. The Scalper’s Edge: 5-Minute Execution Levels
For those trading the immediate volatility, precision is everything. We’ve identified the exact micro-support and resistance zones where the battle is won or lost. See the live setups in our XAU/USD Live Technical Analysis: 5-Minute Scalping Levels.
Conclusion: Stay Focused on the $5,130 Support
In conclusion, our Gold Technical Analysis XAU/USD suggests that while the momentum is vertical, the key to longevity in this trade is the $5,130 support floor. Whether you are scalping the 5-minute chart or holding for the 4-hour target, discipline remains your most valuable asset.
Stay tuned to Gold Compass Daily as we monitor the Asian session open for the next leg of this historic gold run.