

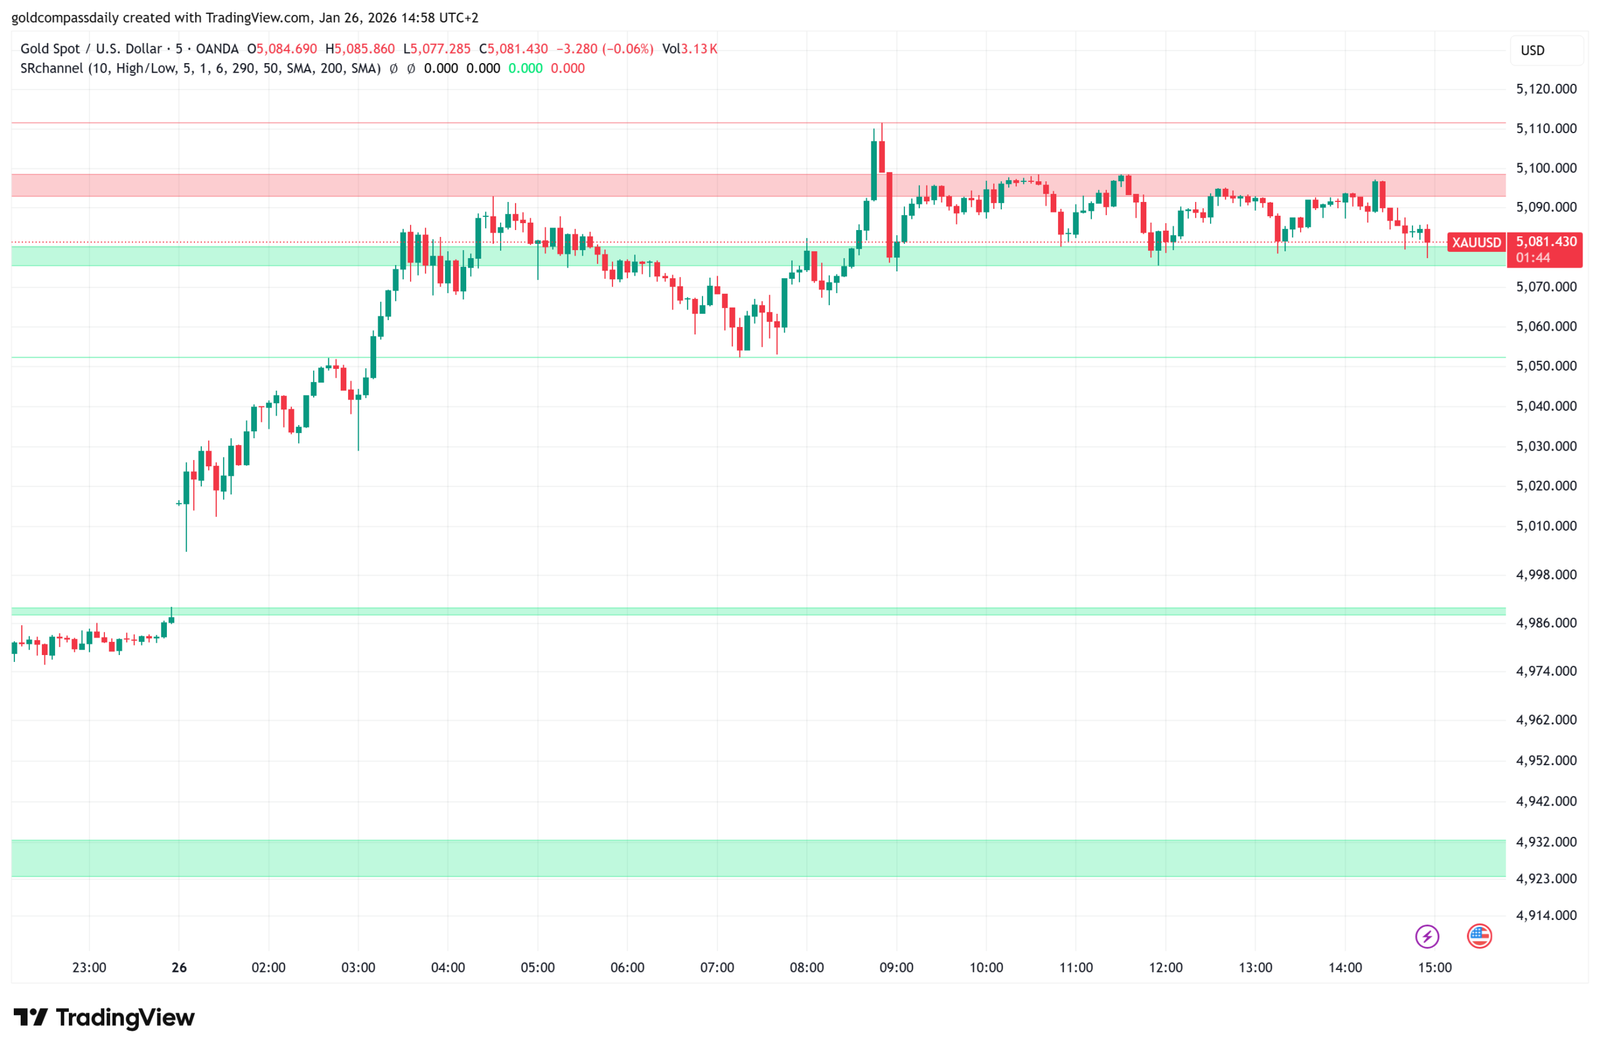
The 5-minute chart of Gold (XAU/USD) just delivered a sharp reminder of why the pre-New York hour is the most dangerous time for retail traders. In a sudden move, price dipped from the $5,091 consolidation zone to test immediate support at $5,081.43.
What is Happening on the 5M Chart?
- The Pre-Open Flush: This move looks like a classic “stop-run.” Large institutional players often push price below visible support levels to trigger sell-stops before a major move in the opposite direction.
- The $5,080 Level: This area is critical. If the 5-minute candle closes and stays above $5,080, it confirms that buyers are still defending the trend.
- Volume Spike: We are seeing an increase in tick volume, suggesting that the “smart money” is starting to position themselves for the 15:30 GMT Durable Goods Orders.
Key Scenarios for the Next 60 Minutes:
As we count down to the New York open, watch these two paths:
- The Spring (Bullish): Price quickly reclaims $5,090, using this dip as fuel to blast through $5,100 once the U.S. data is released.
- The Correction (Bearish): A failure to hold $5,080 could lead to a deeper slide toward the $5,055 psychological support level.
Verdict: Do not be fooled by the 5-minute noise. The overall trend remains bullish, and this dip is likely a strategic “shakeout” before the next leg up.
“Watch the 15:30 candle. High volatility is guaranteed. Ensure your risk management is in place as we enter the most liquid session of the day.”