

Gold trades cautiously at $4,027 on Wednesday, July 15, after a sharp reversal from the $4,100 area during Tuesday’s session drove price back toward the $4,020–$4,028 demand zone. The market is holding in a wait-and-see posture ahead of two high-impact events: the US Producer Price Index release at 3:30 PM UTC+3 and Fed Chair Kevin Warsh’s inaugural Congressional testimony at 5:00 PM UTC+3, which together represent the session’s primary price-discovery catalysts. The bias is hold pending those triggers.
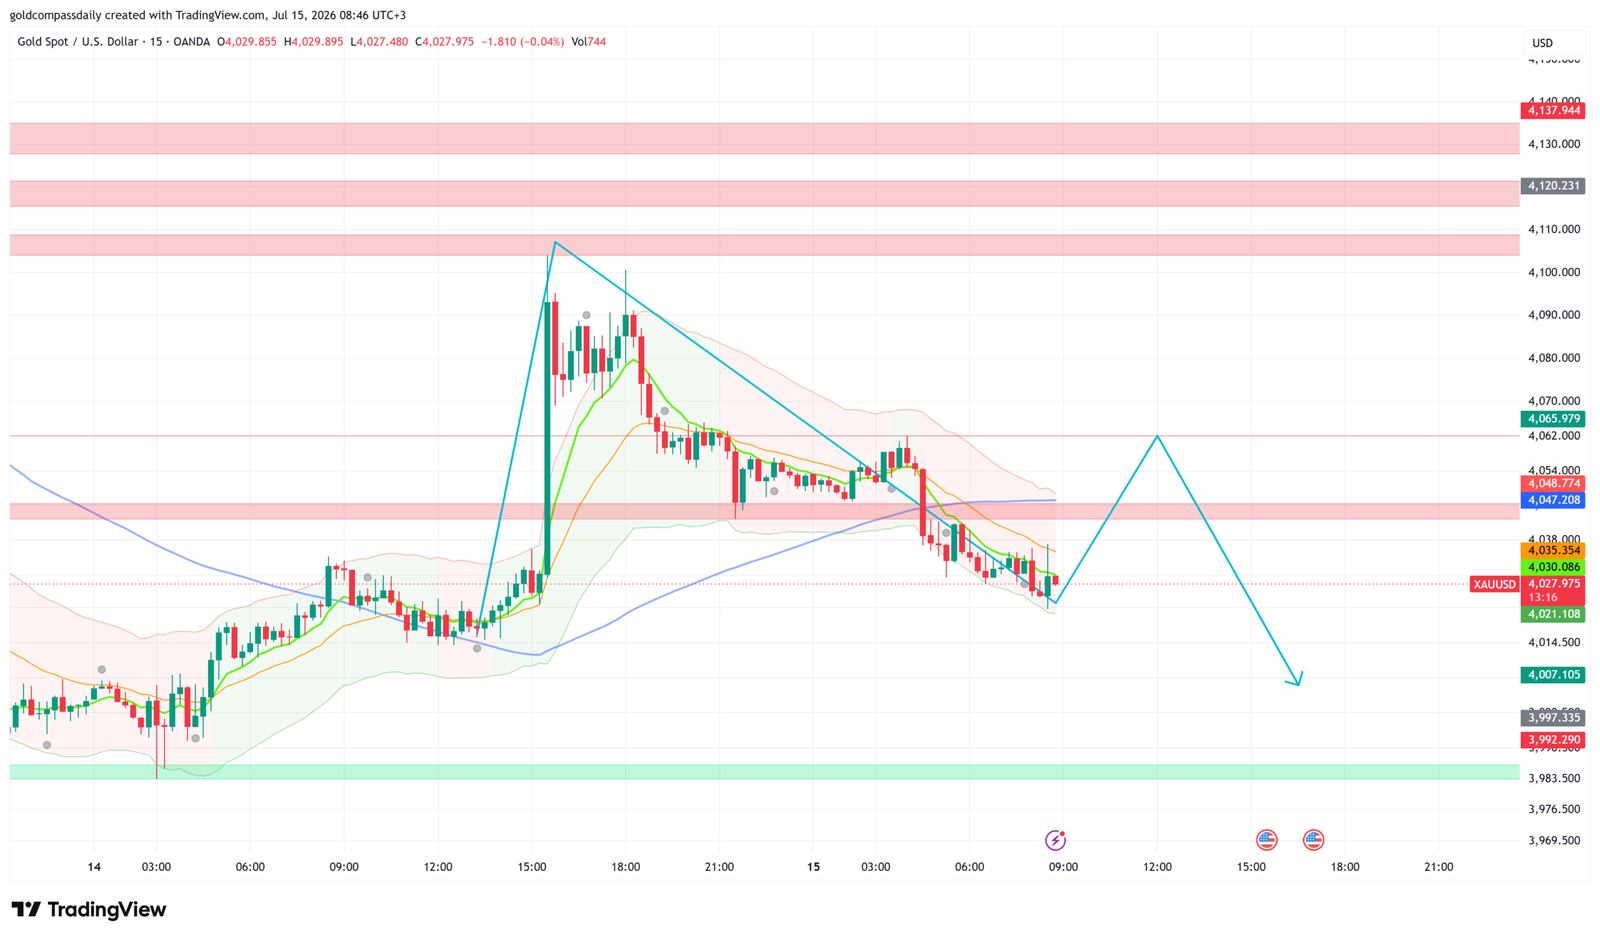
Key Levels
- Bias: Neutral — hold between $4,020 and $4,048; directional break defines the trade
- Support: $4,021 → $4,007
- Resistance: $4,035 → $4,048 → $4,066
- Session bull target: $4,066 conditional on Warsh dovish lean and soft PPI
- Session bear target: $4,007 → $3,992 on hawkish Warsh tone or hot PPI print
- Invalidation: Sustained break below $3,992 opens $3,983 and challenges weekly structure
Catalyst of the Day: Warsh Testimony and US PPI
Wednesday’s session is structured around two sequential USD events that gold traders must treat as a pair. At 3:30 PM UTC+3, US PPI m/m (forecast: 0.0%) and Core PPI m/m (forecast: 0.3%) arrive — the latter’s prior print at 0.4% means any upside surprise would reinforce the “inflation still sticky” narrative and apply direct pressure on gold by strengthening the case for a prolonged Fed hold. One hour and thirty minutes later, at 5:00 PM UTC+3, Fed Chair Kevin Warsh delivers his inaugural Congressional testimony — the first major policy communication test of his chairmanship. Markets have no established template for Warsh’s communication style under pressure, which amplifies the event risk considerably. Any signal that Warsh is more hawkish than Powell on the pace of cuts — or any hedging language around the July–September rate path — would be the most direct downside trigger for gold in this session. Conversely, acknowledgment of cooling growth or deteriorating labor market conditions would be interpreted as opening the door to cuts and provide gold with the footing it needs to recover toward $4,066.
Fundamental Context
Wednesday’s pre-market data introduced a notably mixed fundamental picture. China’s Q2 GDP came in at 4.3% year-on-year, below the 4.5% forecast and a meaningful deceleration from the prior 5.0% reading — the kind of growth miss that historically supports gold through two channels: it weakens risk-on commodity demand from China while simultaneously reinforcing the global growth slowdown narrative that underpins safe-haven allocation. China’s Industrial Production beat modestly at 5.3% versus 4.7% expected, but Fixed Asset Investment contracted sharply at -5.7% year-on-year against a -5.0% forecast, pointing to weakening domestic investment momentum. Retail Sales turned marginally positive at 1.0% against a forecast of -0.1%, offering a partial offset but insufficient to change the broader growth picture. For gold, the net read from China’s data is cautiously supportive — decelerating output with weak investment activity historically tilts policy expectations toward accommodation.
On the Japan side, Core Machinery Orders collapsed to -12.4% month-on-month against a -4.2% forecast — a severe undershoot that raises questions about corporate capex intentions in Asia’s second-largest economy and reinforces the global demand softness theme. The EUR Industrial Production reading (forecast: 0.3%) arrives during the European session window and may contribute to yen and euro dynamics that indirectly influence dollar positioning into the Warsh testimony window. The BOC decision at 4:45 PM UTC+3 — with the Overnight Rate expected to hold at 2.25% — may generate CAD volatility but will be quickly overshadowed by Warsh. The Beige Book at 9:00 PM UTC+3 provides a qualitative read on US regional economic conditions and may revise the post-Warsh narrative if it signals broader deterioration than the headline data suggests.
Chart Analysis
The 15-minute XAU/USD chart as of 08:46 UTC+3 on July 15 confirms the post-$4,100 rejection structure outlined in the input. Price reached approximately $4,108–$4,110 during the July 14 London/early-NY session before reversing sharply and establishing a descending channel through the close. The current print of $4,027.97 sits just above the $4,021 support level, with price having tested that zone this morning before a modest bounce. The Bollinger Bands show a contracted range with price hugging the lower band — a pattern that often precedes a volatility expansion, consistent with the high-impact events ahead. The short-term moving averages (orange/green) are stacked bearishly above current price, with the 50-period MA (blue) acting as overhead resistance near $4,035. The chart’s annotated projected path shows two potential scenarios: a relief bounce to the $4,035–$4,048 resistance cluster followed by a continuation lower toward $4,007, or an immediate break of $4,021 targeting $4,007 and $3,992. The key resistance cluster at $4,047–$4,048 aligns with the horizontal zone visible on the chart and must be reclaimed on a closing basis to shift the intraday structure from bearish to neutral. The broader overhead resistances at $4,066, $4,120, and $4,138 remain untested and define the upper range of any recovery scenario.
Bull and Bear Scenarios
Bull Scenario
Trigger: US Core PPI m/m prints at 0.2% or below and Warsh testimony acknowledges slowing growth momentum or signals openness to rate cuts before year-end → Gold breaks above $4,048, targets $4,066 within the session, with $4,080 possible on sustained follow-through. Invalidated on a close back below $4,035.
Bear Scenario
Trigger: Core PPI prints at 0.4% or above, or Warsh strikes a clearly hawkish tone — emphasizing inflation persistence and pushing back on 2026 cut expectations → Gold breaks $4,021, accelerates toward $4,007, and risks $3,992 on sustained selling. Invalidated on a close back above $4,035.
Events Ahead
- Wed 3:30 PM UTC+3 — US PPI m/m (forecast: 0.0%) and Core PPI m/m (forecast: 0.3%): First direct USD inflation data of the week; a hot Core PPI print would reinforce the Fed hold narrative and pressure gold
- Wed 3:30 PM UTC+3 — Empire State Manufacturing Index (forecast: 9.3): Secondary read on US economic momentum; a sharp miss would support safe-haven demand
- Wed 3:45 PM UTC+3 — FOMC Member Williams Speaks: May set the stage contextually ahead of Warsh; watch for any divergence in tone
- Wed 5:00 PM UTC+3 — Fed Chair Warsh Testifies: The session’s defining event; first Congressional appearance as chair — any policy signal or communication style read will move gold
- Wed 5:30 PM UTC+3 — US Crude Oil Inventories (forecast: -1.8M): Secondary macro read; a large draw supports risk-on and may dampen gold’s safe-haven appeal
- Wed 9:00 PM UTC+3 — Beige Book: Qualitative US regional economic assessment; deteriorating conditions language would be late-session support for gold
- Thu Jul 17 — US Retail Sales and Jobless Claims: Final significant data inputs before the weekend that will shape the July FOMC rate-cut probability into next week
Gold Compass Daily’s full weekly outlook, including the macro framework and prior session context, is available in the July 13–17 weekly hub article. The prior session analysis is available in Tuesday’s morning article.
New York Session Update
Price Check
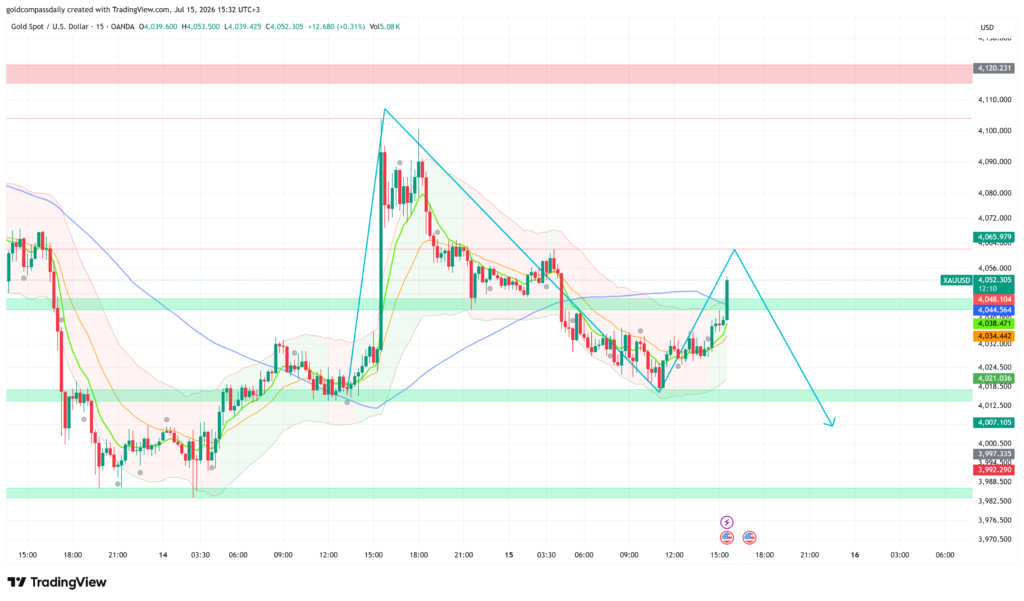
Gold has broken decisively above the morning’s key resistance cluster, trading at $4,052 as of 15:32 UTC+3 — a $25 recovery from the $4,028 level cited in the morning analysis. The hold bias from the morning session has resolved to the upside, with price clearing the $4,048 resistance zone that Gold Compass Daily’s morning analysis identified as the threshold for a structural shift.
What Changed
The catalyst was the US PPI data released at 3:30 PM UTC+3. Headline PPI m/m came in at 0.0% — in line with the 0.0% forecast — while Core PPI m/m printed at 0.3%, below the prior 0.4% reading. The softer core producer inflation read was sufficient to revive rate-cut expectations and weaken the dollar, triggering the sharp leg higher in gold. Price bounced from the $4,021 support zone — which held precisely as outlined this morning — and has since rallied through $4,035, $4,044, and $4,048 in rapid succession on elevated volume (5.08K versus the morning’s 744). The primary event risk — Fed Chair Warsh’s inaugural Congressional testimony — remains ahead at 5:00 PM UTC+3 and is the next binary trigger that will determine whether this PPI-driven bid extends or reverses.
Updated Levels
- Current price: $4,052
- Bias now: Cautiously Bullish — PPI has shifted momentum upward, but Warsh testimony remains a live risk in both directions
- Updated support: $4,044 → $4,034 → $4,021
- Updated resistance: $4,056 → $4,066 → $4,072
- NY session target: $4,066 on dovish Warsh lean; $4,021 on hawkish reversal
Scenarios Into the Close
Bull: Warsh acknowledges easing inflation progress or signals openness to a 2026 cut → gold sustains above $4,048, extends toward $4,066 and potentially $4,072 into the close.
Bear: Warsh strikes a hawkish tone — pushing back on cut timing or emphasising persistent services inflation — → price reverses below $4,034, targets $4,021 and risks unwinding the entire PPI-driven move toward $4,007.
Chart Analysis
The 15-minute chart as of 15:32 UTC+3 shows a sharp V-shaped recovery from the $4,018–$4,021 support band, which was tested during the early New York session before the PPI release triggered a near-vertical rally. Price has reclaimed the $4,044–$4,048 horizontal resistance zone — now acting as immediate support — and the short-term moving averages (orange and green) have crossed bullishly, with price trading above all visible MAs for the first time since the $4,110 rejection on July 14. The Bollinger Bands have expanded sharply to the upside, with price piercing the upper band — a momentum confirmation, though it also signals the move is extended short-term and vulnerable to a retest of $4,044 before continuation. The annotated projected path on the chart shows a potential fade back toward $4,007 following a brief spike to the $4,044–$4,048 area, which aligns with the scenario where Warsh disappoints bulls. The $4,021 green support band and the $4,007 level below it remain the structural floor; a close above $4,056 would open $4,066 as the next material resistance.
Analysis based on the XAU/USD 15-minute chart as of July 15, 2026 at 08:46 UTC+3. This article is for informational and educational purposes only and does not constitute financial advice.