

Weekly Thesis
Gold enters the week of July 13–17, 2026 at $4,064 — parked directly above a multi-week structural floor at $4,027 after a second consecutive weekly decline that has pulled the metal 27% below its all-time high of $5,589 reached on January 29. The week is defined by a single binary question: does Tuesday’s June CPI report, arriving simultaneously with Federal Reserve Chairman Kevin Warsh’s inaugural Congressional testimony, confirm that disinflation is resuming — or does it reveal that price pressures remain too stubborn for the Fed to abandon its rate-hike optionality? The answer will determine whether the $4,027 floor holds and gold rebuilds toward $4,300, or whether bears finally achieve the decisive breakdown that five weeks of selling pressure have failed to deliver.
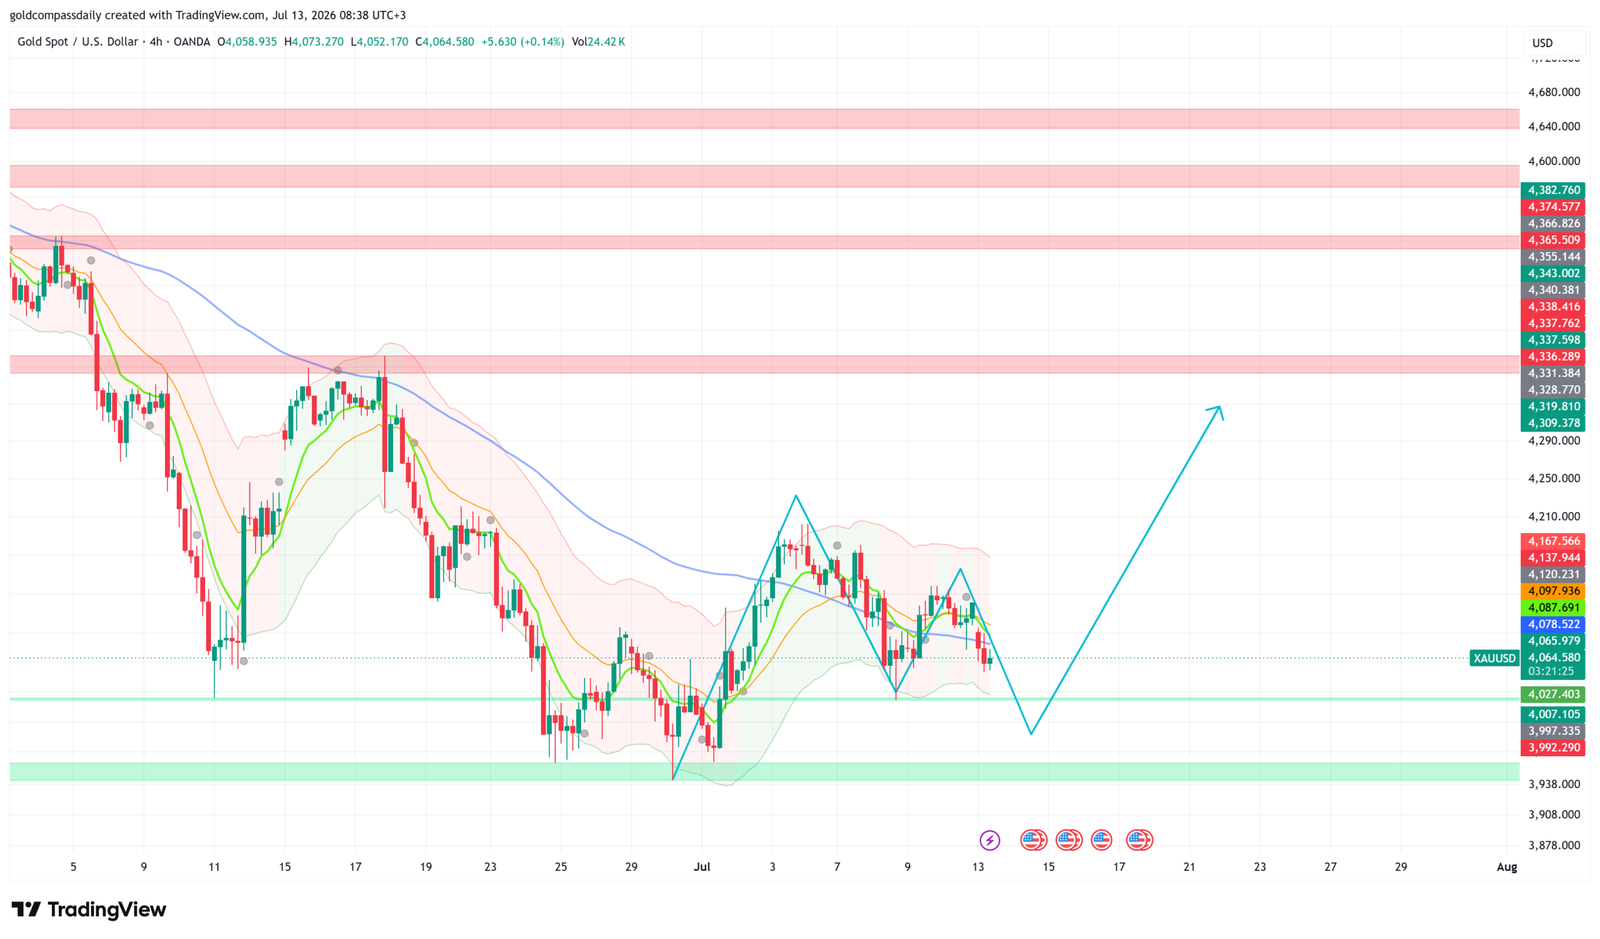
Key Levels for the Week
- Weekly bias: Cautiously Bullish above $4,027 — Bearish on a confirmed close below
- Key support: $4,027 (chart floor, five-week base) → $3,992–$3,997 (secondary cluster)
- Key resistance: $4,078 → $4,097 → $4,120 (4H moving average convergence) → $4,138 → $4,168
- Upper resistance zone: $4,309–$4,383 (dense supply band visible on chart)
- Weekly bull target: $4,309 (conditional on CPI softening and Warsh remaining data-dependent without hiking language)
- Weekly bear risk: $3,992 → $3,938 (conditional on CPI upside surprise and hawkish Warsh tone)
- The floor: $4,027 — a weekly close below this level removes the structural base built since early June and opens a measured move toward $3,938
The Week’s Defining Event
Tuesday, July 14 carries two simultaneous market-moving catalysts that, combined, constitute the single most important session for gold pricing this quarter. June CPI prints at 8:30 AM ET (3:30 PM UTC+3), with headline inflation expected to fall to -0.1% month-on-month — the softest monthly reading in over a year — driven almost entirely by a 4.4% collapse in energy prices following the mid-June Strait of Hormuz reopening. Ninety minutes later, Federal Reserve Chairman Kevin Warsh takes the seat before the House Financial Services Committee for his semi-annual monetary policy testimony. The two events are inseparable: a benign headline CPI number means nothing for gold if Warsh uses his testimony to emphasise that core inflation at 2.8–2.9% and elevated services prices justify keeping the door open to further tightening. Conversely, even a modestly higher-than-expected core CPI print could be offset if Warsh echoes the more balanced tone he struck at the ECB Forum in Sintra — where he noted that inflation expectations and risks had both declined. Gold Compass Daily’s analysis identifies this Tuesday double-event as the primary price-discovery session for XAU/USD this week, with every other data release secondary to the CPI-Warsh combination.
Macro Context
Gold enters this week as a metal caught between two contradictory forces. On the fundamental side, the structural case for gold remains intact: central bank purchasing continues, with the People’s Bank of China extending its reserve accumulation into a 20th consecutive month in June; US federal debt exceeds $37 trillion and generates over $1 trillion in annual interest, creating a fiscal backdrop historically correlated with gold’s long-term bid; and institutional year-end price targets from Goldman Sachs ($5,400), JPMorgan (~$6,000), and Morgan Stanley ($5,200) sit 33–48% above current levels. On the policy side, the Federal Open Market Committee is split 9-to-8 between participants who expect at least one rate hike before year-end and those projecting no change — a division confirmed by FOMC minutes released on July 8, 2026. The CME FedWatch Tool currently prices approximately a 20% probability of a 25 basis-point hike at the July 29 meeting and roughly 60% odds of one hike by September. This rate-hike optionality, absent from gold market pricing for much of 2025, has been the primary driver of the metal’s decline from its January high and remains the central suppressor of any sustained recovery bid.
Technically, the 4-hour chart as of July 13 confirms that gold has spent five consecutive weeks defending the $4,027–$4,030 structural floor without recording a decisive weekly close below it — a pattern that represents sustained selling pressure without seller conviction. The green and orange 4H moving averages have crossed bearish, and the longer blue moving average is descending from the $4,100–$4,120 zone, acting as a technical ceiling that has capped every intraweek recovery attempt since early July. The chart’s annotated projection — a brief dip toward the $3,992–$4,007 zone before a recovery targeting $4,309 — aligns with the macro scenario in which CPI softens as expected and Warsh avoids explicit hiking language, releasing pent-up dip-buying demand that has accumulated at the $4,027 floor. The near-term path of least resistance remains lower while price stays beneath $4,097, but the structural case for a base formation is growing with each week that sellers fail to print a sub-$4,000 weekly close.
The broader macro context adds important nuance. May CPI rose to 4.2% year-on-year — the highest since April 2023 — driven by a 23.5% energy spike tied to the Iran conflict and the temporary closure of the Strait of Hormuz. That energy shock is now reversing: oil prices plunged approximately 21% following the mid-June ceasefire, pulling gasoline prices sharply lower and setting up June’s headline CPI for a potentially negative monthly print. However, the Federal Reserve’s June projections — the first under Warsh’s chairmanship — revised the bank’s 2026 headline CPI forecast up to 3.6% from 2.7% and nudged the median fed funds rate projection to 3.8%, signaling that the institution views energy volatility as less decisive than the persistence of core services inflation. Goldman Sachs forecasts a 0.17% month-on-month core CPI increase for June — slightly below the 0.2% consensus — which would bring the annual core rate to 2.8% from 2.9%. If realised, this would represent the first back-to-back monthly softening in core inflation since late 2025, providing the gold market with its strongest fundamental justification for a recovery bounce since the metal’s correction began.
Daily Event Calendar
- Monday, July 13 — 12:25 PM UTC / 3:25 PM UTC+3 — FOMC Member Bowman Speaks: Bowman has been among the more hawkish FOMC members; any comments reinforcing the hike-ready stance ahead of Tuesday’s CPI could pressure gold below $4,050 before the key data.
- Monday, July 13 — 7:30 PM UTC / 10:30 PM UTC+3 — FOMC Member Waller Speaks: Waller’s tone on the inflation-growth tradeoff will set the late-session tone for positioning ahead of Tuesday; a balanced view supports the $4,027 floor.
- Tuesday, July 14 — 3:30 PM UTC+3 (8:30 AM ET) — US Core CPI m/m (forecast 0.2% / prior 0.2%) and US CPI y/y (forecast 3.8% / prior 4.2%): The week’s primary price-discovery event for gold. A print at or below 0.2% core monthly and 3.8% headline annual should trigger an immediate relief rally toward $4,097–$4,120. An upside surprise above 0.3% core monthly would accelerate selling toward $4,027 and below.
- Tuesday, July 14 — 5:00 PM UTC+3 (10:00 AM ET) — Fed Chairman Warsh Testifies (House Financial Services Committee): Arriving 90 minutes after CPI, Warsh’s opening statement and responses to lawmakers will be parsed for any shift from his Sintra comments that inflation risks have declined. Explicit mention of hike readiness would override any CPI softness; a balanced data-dependent framing would amplify the gold rally.
- Tuesday, July 14 — 1:00 PM UTC+3 (6:00 AM ET) — US NFIB Small Business Index (forecast 95.6 / prior 95.3): A leading indicator of small-business confidence and hiring intent; a sharp decline below 94 would add recession-risk narrative supporting safe-haven gold ahead of CPI.
- Wednesday, July 15 — 5:00 AM UTC+3 — China Q2 GDP (forecast 4.5% / prior 5.0%), Industrial Production y/y (forecast 4.6%), Retail Sales y/y (forecast -0.1%): A below-consensus Chinese GDP print would add global slowdown narrative and secondary safe-haven support for gold; an outperformance would reduce urgency of Chinese central bank gold accumulation, modestly negative at the margin.
- Wednesday, July 15 — 3:30 PM UTC+3 (8:30 AM ET) — US Core PPI m/m (forecast 0.3% / prior 0.4%) and PPI m/m (forecast 0.0% / prior 1.1%): The second consecutive inflation reading of the week; a cooling PPI following a soft CPI would confirm the disinflation narrative and extend gold’s recovery, pushing toward $4,138–$4,168. A hot PPI would re-open the rate-hike debate and claw back Tuesday’s gains.
- Wednesday, July 15 — 5:00 PM UTC+3 (10:00 AM ET) — Fed Chairman Warsh Testifies (Senate Banking Committee): Second day of Congressional testimony; follow-up questions from senators on rate-hike timing will probe whether Warsh’s first day represented genuine policy signaling or diplomatic ambiguity.
- Wednesday, July 15 — 6:45 PM / 7:30 PM UTC+3 — Bank of Canada Rate Decision (forecast hold at 2.25%): A BOC hold confirms North American central banks remain in pause mode; a surprise cut would weaken CAD but also reduce global rate-hike pressure narrative, mildly supportive for gold.
- Thursday, July 16 — 3:30 PM UTC+3 (8:30 AM ET) — US Core Retail Sales m/m (forecast -0.1% / prior 0.8%) and US Retail Sales m/m (forecast 0.3% / prior 0.9%): Consumer spending data will be the week’s third major USD macro catalyst. A miss relative to the 0.3% headline forecast would reinforce growth-deceleration fears, potentially adding a stagflation bid to gold even as rate-hike expectations moderate.
- Thursday, July 16 — 3:30 PM UTC+3 — US Unemployment Claims (forecast 215K / prior 215K) and Philly Fed Manufacturing Index (forecast 12.1 / prior 10.3): Labour market stability and manufacturing resilience would reduce recession-risk bids in gold; a surprise rise in claims above 230K would be the most gold-positive labour print of the week.
- Friday, July 17 — 5:00 PM UTC+3 (10:00 AM ET) — Prelim UoM Consumer Sentiment (forecast 51.4 / prior 49.5) and UoM Inflation Expectations (prior 4.6%): The week’s closing catalyst. An upside surprise in the inflation expectations component — even with improving sentiment — would revive rate-hike concern and cap any recovery rally at the $4,168–$4,200 zone heading into the weekend.
Weekly Bull / Bear Scenarios
Bull Case — Target: $4,250–$4,309
June core CPI prints at or below 0.2% month-on-month, with the annual rate declining to 2.8%. Chairman Warsh’s Congressional testimony echoes his Sintra comments — acknowledging that inflation expectations have declined and reaffirming the Fed’s data-dependent, meeting-by-meeting posture without any explicit reference to hike readiness. Wednesday’s PPI confirms the disinflation trend with a flat or negative monthly headline. Gold breaks above the 4H moving average cluster at $4,097–$4,120 on Tuesday, consolidates mid-week, and extends toward $4,168–$4,200 on Thursday’s retail sales miss. The $4,027 floor is never tested during the week, and the metal closes the week above $4,120 — its first weekly close above this level since late June. This scenario targets $4,250 initially, with $4,309 achievable on institutional re-entry following the confirmation that the floor held.
Bear Case — Downside Risk: $3,992–$3,938
June core CPI surprises to the upside, printing at 0.3% or above month-on-month, with services and shelter components remaining sticky. Warsh uses his Congressional testimony to explicitly state that the FOMC has not ruled out a July rate hike and that inflation remains above target in a way that demands vigilance. The dollar index extends its 2026 recovery, and real yields rise further, removing gold’s safe-haven premium. The metal breaks the $4,027 floor on Tuesday with a closing 4H candle below the level, triggering stop-loss selling toward $3,992–$3,997. If that secondary support also fails, $3,938 — the next visible structural zone on the chart — comes into play by Thursday or Friday. This scenario would represent gold’s first weekly close below $4,027 in five weeks and would invalidate the base-formation thesis, opening a measured move toward $3,878.
This Week’s Daily Analysis
- Monday, July 13 — Gold opens the week at $4,064, holding just above the five-week structural floor at $4,027. Pre-CPI positioning dominates early sessions; FOMC members Bowman and Waller speak in the New York session. Markets await Tuesday’s defining double-event.
- Tuesday, July 14 — US June CPI and Fed Chair Warsh’s Congressional testimony arrive simultaneously, representing the week’s primary price-discovery event for XAU/USD. The outcome of this session will define gold’s directional bias for the remainder of the week.
- Wednesday, July 15 — China Q2 GDP data and Warsh’s second day of Senate testimony arrive alongside the US PPI report. The Bank of Canada delivers its rate decision. A second consecutive inflation catalyst for gold in 48 hours.
- Thursday, July 16 — US Retail Sales, Unemployment Claims, and the Philly Fed Manufacturing Index test the consumer and labour market narrative. UnitedHealth earnings provide healthcare sector context amid the broader macro backdrop.
- Friday, July 17 — Preliminary University of Michigan Consumer Sentiment and Inflation Expectations close the week. The sentiment reading, particularly the inflation expectations component, will determine whether gold can hold any recovery gains heading into the weekend close.
Analysis based on the XAU/USD 4-hour chart as of July 13, 2026, 08:38 UTC+3. This article is for informational and educational purposes only and does not constitute financial advice.