
Gold Price Analysis 2026: Navigating the Most Volatile Week in Decades
The gold market has just sent shockwaves through the global financial system. In a staggering turn of events in early February 2026, gold plummeted from all-time highs, wiping out trillions in market capitalization in a matter of days. For many, this Gold Price Analysis 2026 is no longer just about trading—it is about understanding the safety of their life savings.


While the headlines are focused on the “crash,” the charts tell a more nuanced story of a market trying to find its feet. To understand where we are going, we must look at the different layers of price action, from the broad 4-hour trends to the rapid 5-minute recoveries.
The Big Picture: From $5,500 to Support
Looking at the higher timeframes, gold’s fall was as vertical as its rise. After breaching the $5,200 and $5,500 levels in late January, the market became “overextended.” This led to a massive liquidation event. Our previous 4-hour analysis highlighted the risk of this parabolic move collapsing, and that is exactly what we witnessed.
However, as of February 3, 2026, we are seeing the first signs of a floor. The price has settled around the $4,700 – $4,800 range, a zone that many analysts, including those at J.P. Morgan, view as a potential accumulation area before a run toward $6,000 later this year.
Short-Term Recovery: The 5-Minute “V-Shape”
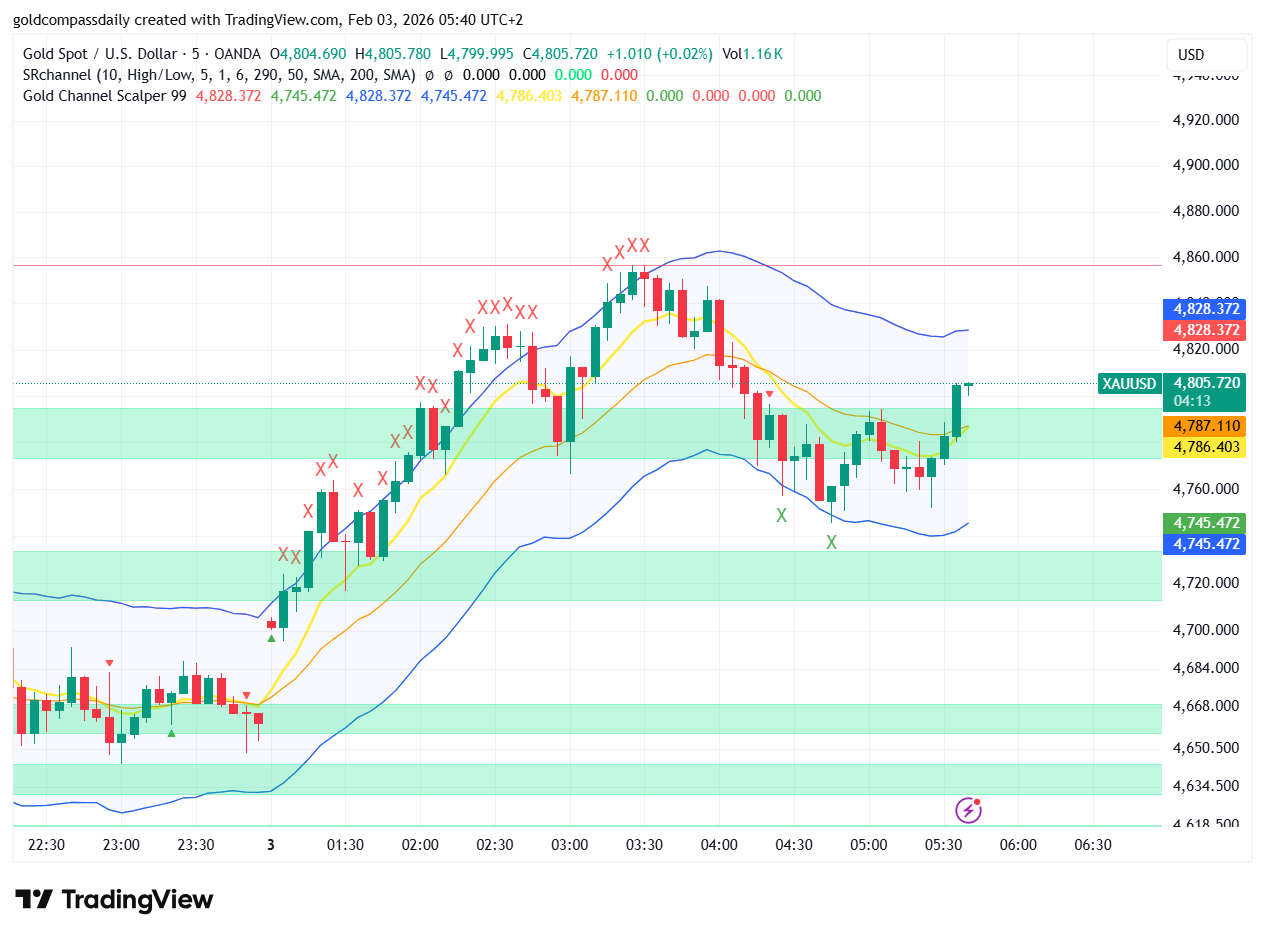
On the lowest timeframes, the panic is starting to turn into a “buy the dip” mentality. The 5-minute chart shows a clear V-shaped recovery where buyers stepped in aggressively at the $4,745 mark. This indicates that while the “weak hands” sold in fear, institutional players are starting to re-enter their positions. You can see the detailed breakdown of this micro-trend in our 5-minute analysis.
Why This Gold Price Analysis 2026 Matters Right Now
The current volatility is driven by a “perfect storm” of factors. Geopolitical tensions, shifts in US Federal Reserve leadership, and profit-taking after a historic rally have all converged. But for the average person, the most important question is: Is gold still a safe haven?
- Central Bank Demand: Despite the price drop, central banks are still expected to buy 800 tons of gold in 2026 to diversify away from the dollar.
- Psychological Levels: The $4,800 mark is the “line in the sand.” Staying above this suggests the bull market is wounded but not dead.
- Forecast Targets: Major banks like Deutsche Bank and UBS remain bullish, with targets reaching as high as $6,300 by year-end.
Is the Bottom Finally In?
Our Gold Price Analysis 2026 suggests we are in a “wait and see” period. As discussed in our 1-hour forecast, gold needs to consolidate. A move that drops 10% in a day doesn’t usually recover in an hour. It needs time to build a “base” of support.
If gold can maintain its current stability through the first half of February, the “crash” will likely be remembered as a massive healthy correction in a long-term bull market. If you are considering entering the market, current prices are significantly more attractive than they were just five days ago, but caution is still required.
Conclusion: Staying Calm in the Chaos
Volatility is the price investors pay for the security gold provides during global uncertainty. While the recent moves have been historic, the fundamental reasons for owning gold—inflation protection and currency diversification—have not changed. Watch the $4,750 support level closely; it will tell you everything you need to know about the next move.