
Gold Price Forecast 2026: Navigating the Most Volatile Week in Decades
The first days of February 2026 have etched themselves into financial history. After gold reached a staggering record peak of nearly $5,600 in late January, the market witnessed a violent “metals meltdown,” plunging over 21% in just three sessions. However, as of Tuesday, February 3, the tide is turning. This Gold Price Forecast 2026 provides an multi-timeframe analysis of today’s historic 5.8% rebound—the largest one-day jump since the 2008 financial crisis.


The recent volatility was ignited by the “Warsh Shock”—the nomination of Kevin Warsh as the next Fed Chair—and a landmark US-India trade deal that reshaped global risk sentiment. While speculative froth has been “cleaned out” by margin calls and systematic fund liquidation, long-term buyers are now returning to the “freshly cleaned playground” of the bullion market.
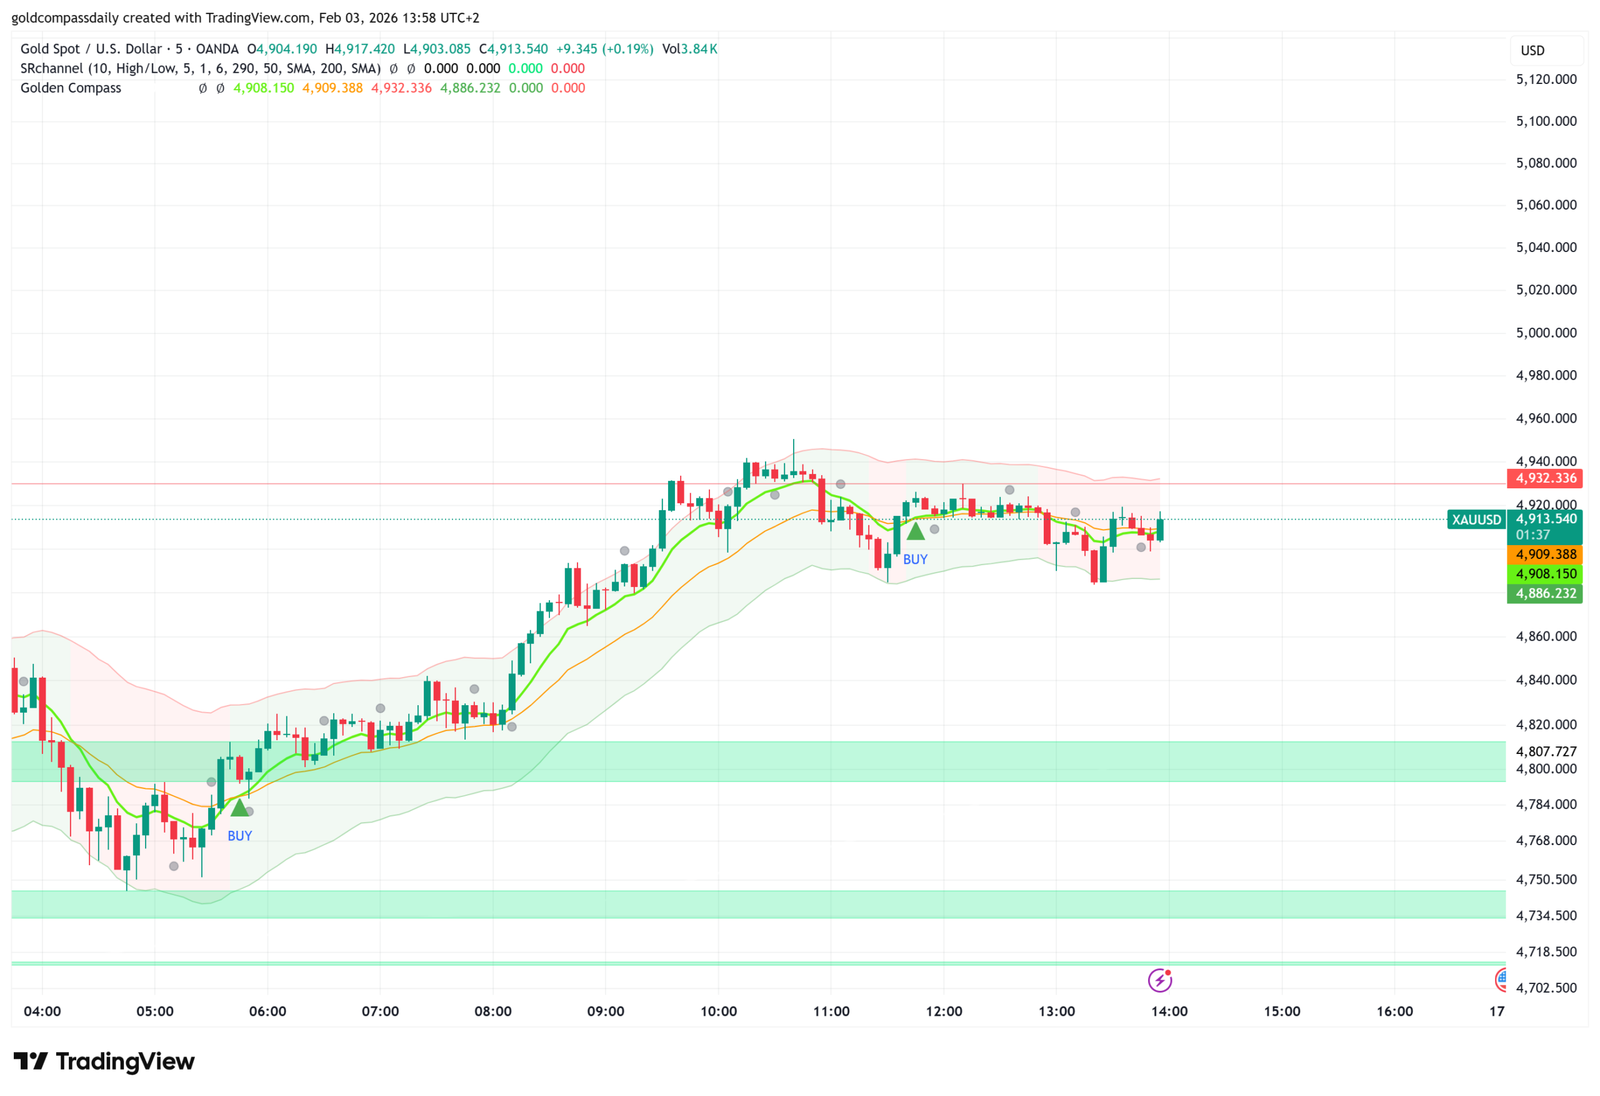
Intraday Dynamics: The 5-Minute “V-Shape” Recovery
On the 5-minute timeframe, gold has demonstrated incredible momentum today, climbing back toward the $4,939 level. This rapid recovery follows a brief “wick down” to $4,400 earlier in the week, where bargain hunters finally overwhelmed the aggressive selling pressure. For those tracking micro-trends, our 5-minute intraday analysis shows how the breach of immediate resistance at $4,858 has shifted focus back toward the psychological $5,000 mark.
Hourly Chart: The Battle for the $4,800 Pivot
The 1-hour (H1) chart reveals a more structural shift in sentiment. After prices stabilized following the “worst day for gold in 46 years,” a clear trend of higher highs is beginning to form. As detailed in our hourly gold analysis, the market is currently testing the 23% Fibonacci retracement level. A sustained hourly close above $4,940 is critical for bulls to maintain this momentum and target the next resistance zone at $5,050.
Higher Timeframes: H4 and the Long-Term Outlook
From a 4-hour (H4) perspective, the technical damage from the 10% single-day crash on Friday is still being repaired. A “Rising Three Methods” candlestick pattern has formed near $4,701, signaling that the initial panic may have subsided in favor of a consolidation phase. Our 4-hour price forecast highlights that while the short-term trend is “moderately bullish,” the upside remains capped around $5,000 due to upcoming US labor data and the strengthening US Dollar.
Key Levels for the Week Ahead
- Major Resistance ($5,000 – $5,050): Reclaiming the $5,000 handle is the ultimate goal for bulls to invalidate the recent bearish crossover.
- Immediate Support ($4,821): The market must hold above this level to prevent a retest of the week’s lows.
- The Floor ($4,400): This represents the bottom of the recent 21% dive and remains the most significant psychological support zone.
Why the 2026 Bull Run Isn’t Over
Despite the recent carnage, the fundamental pillars supporting gold remain robust. Central bank demand continues to be a massive tailwind, with J.P. Morgan forecasting 800 tonnes of gold purchases in 2026 as nations seek to reduce reliance on the USD. Furthermore, ongoing G7 debt dynamics and geopolitical uncertainty ensure that safe-haven demand remains a structural part of investor portfolios.
Conclusion: A “Healthy” Correction in a New Era
The Gold Price Forecast 2026 suggests that while the parabolic surge of January was unsustainable, the underlying appetite for gold is durable. Today’s historic rebound confirms that investors view the recent dip as an extreme value opportunity. Whether gold can reclaim its $5,600 peak this month depends on the Fed’s next move, but for now, the bulls have successfully defended the line.