

Gold trades bearish at $4,423 on Tuesday, September 8 — pinned below the post-crash resistance zone after Friday’s blowout August Nonfarm Payrolls report drove Federal Reserve rate hike expectations to their highest level in months. The metal recovered from an intraday low of $4,381 but has so far failed to reclaim the $4,430–$4,435 area, where sellers have reasserted control. Until CPI data on Wednesday resets the calculus, the path of least resistance points lower.
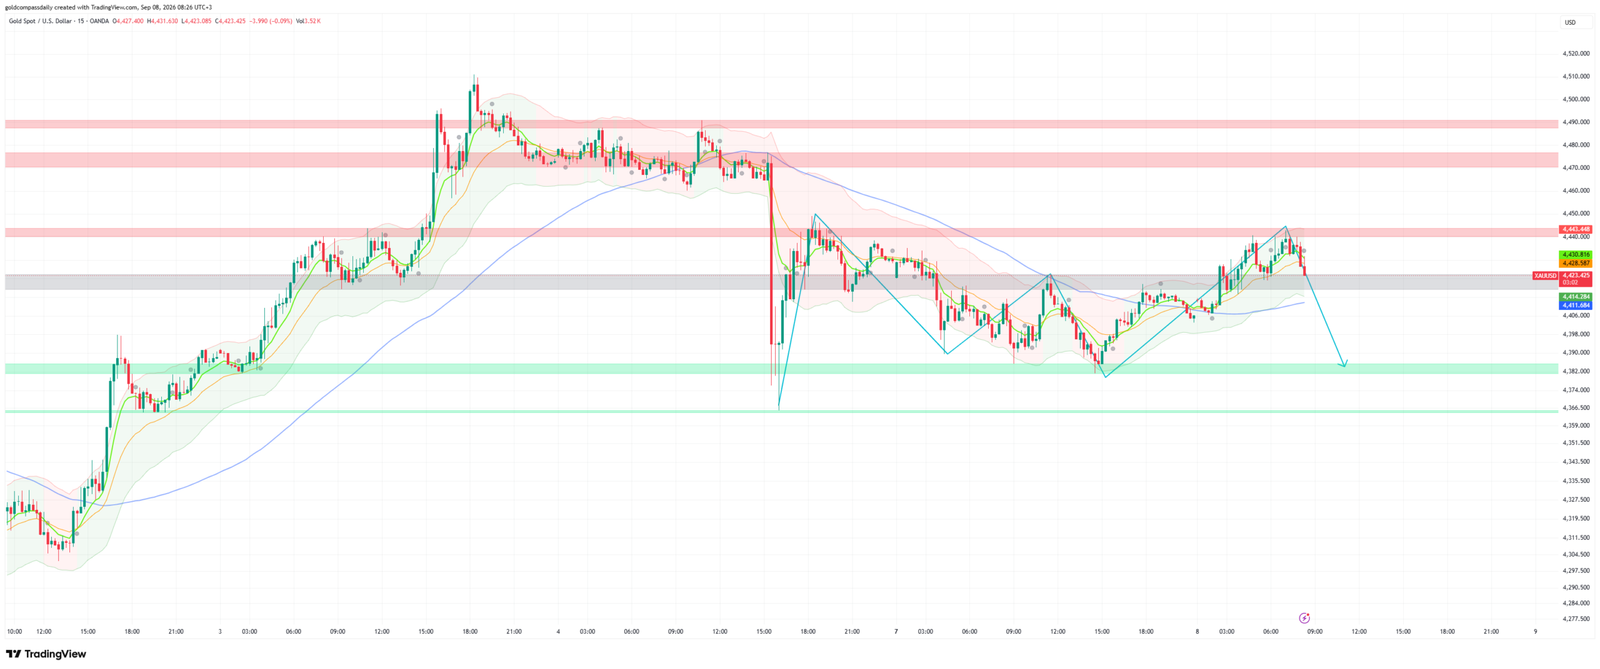
Key Levels
- Bias: Bearish below $4,430
- Support: $4,382 → $4,366
- Resistance: $4,430 → $4,450 → $4,480
- Session target: $4,382 (on NFIB miss or continued dollar strength)
- Invalidation: Sustained close above $4,435 = short-term structure shifts neutral
Catalyst of the Day
The primary catalyst carrying over from Friday remains the August Nonfarm Payrolls print: 162,000 jobs added against a market expectation of just 56,000 — a threefold beat that immediately reloaded Federal Reserve rate hike speculation and drove the dollar index sharply higher. For gold, which pays no yield, a higher-for-longer Fed is directly corrosive: it raises the opportunity cost of holding the metal while simultaneously strengthening the dollar in which it is priced. Market-implied probability of a September 15–16 FOMC rate hike now sits near 60%, according to CME data, keeping pressure on XAU/USD as traders position defensively ahead of Wednesday’s August CPI release. Today’s secondary catalyst — the NFIB Small Business Optimism Index at 1:00 PM EST (8:00 PM UTC+3) — carries forward guidance weight: a print above 99.8 (the prior reading) would reinforce the narrative that the U.S. economy is running hotter than the Fed’s comfort zone, adding further headwinds for gold into the New York afternoon session.
Fundamental Context
Friday’s labour market data did more than move gold lower — it fundamentally shifted the Fed narrative that had been softening through July and August. The August payroll beat of 162,000, compounded by a revised July figure of just 23,000, suggests the U.S. labour market is re-accelerating after a brief soft patch. The unemployment rate held at 4.1% while annual wage growth eased to 3.1%, a marginal deceleration that fell short of the cooling the Fed needs to justify holding rates. For gold, the implication is clear: the probability of a cut before year-end has collapsed, and the probability of another hike has surpassed 58%. Higher real rates are the single most reliable short-term negative for gold, and the NFP data has brought that scenario back into the foreground.
Japan’s data released overnight — Average Cash Earnings rising 4.7% year-on-year against a 3.8% forecast, alongside a stronger-than-expected Current Account surplus of ¥2.52 trillion — points to a Bank of Japan that may also need to revisit its ultra-loose policy stance. A less dovish BoJ strengthens the yen, which historically travels in the same direction as gold during risk-off regimes. However, with the dominant driver today being dollar strength from the Fed repricing, yen dynamics offer only a marginal offset to gold’s primary headwind. China’s trade surplus widening to $119.1 billion (USD-denominated) provides a constructive demand backdrop for commodities broadly, but does not materially alter gold’s near-term trajectory while monetary tightening expectations dominate sentiment.
Chart Analysis
The 15-minute XAU/USD chart (OANDA, UTC+3) shows a market operating in a clearly defined post-crash range. Following the sharp vertical drop on September 4 — which took price from the $4,490 area to the $4,360s in a single session — gold has formed a series of lower highs and lower lows. The gray structural band at $4,420–$4,430 has contained two recovery attempts and is acting as resistance, not support. At the time of analysis ($4,423), price is testing the upper edge of that zone from below with momentum flattening: the short-term moving averages (yellow/orange) are flat, and the longer blue average is still trending downward, confirming that sellers remain structurally in control. The chart’s projected path — illustrated by cyan projection lines — anticipates a final push toward the $4,440–$4,445 area before a rejection and resumption of the downtrend toward the primary green support band at $4,382–$4,390, which has absorbed selling pressure three times since the September 4 crash. A clean break of $4,382 opens the lower green support zone at $4,366–$4,374, consistent with the broader bearish structure. Gold Compass Daily confirms the bearish bias; the $4,421–$4,430 zone is identified as a sell area, not a base.
Bull / Bear Scenarios
Bear Scenario (Primary)
Trigger: Price fails to sustain above $4,430 and the NFIB index prints at or above 99.8.
Action: Bearish continuation activates toward $4,382, with an extended target at $4,366 on a clean break.
Confirmation: 15-minute candle close below $4,410 after any early-session bounce.
Bull Scenario (Secondary)
Trigger: NFIB prints significantly below 99.4 (the forecast), or dollar index retreats, driving a sustained break and close above $4,435.
Action: Short-term recovery toward $4,450, with potential for a test of $4,480 only if CPI expectations soften materially.
Confirmation: 15-minute candle close above $4,435 with volume expansion.
Events Ahead This Week
- Tuesday, Sep 8 — 1:00 PM EST: NFIB Small Business Index (forecast 99.4): A beat reinforces the strong-economy narrative, adding pressure on gold by supporting the case for a September Fed hike.
- Wednesday, Sep 10 — 8:30 AM EST: US CPI (August): The week’s primary catalyst for gold. A hotter-than-expected print confirms the Fed’s tightening bias and could push XAU/USD toward the $4,280–$4,300 zone; a miss reopens the path toward $4,480+.
- Thursday, Sep 11 — 8:30 AM EST: US PPI (August): Secondary inflation data. Confirms or contradicts the CPI signal; elevated PPI would reinforce bearish gold positioning into the FOMC meeting.
- Thursday, Sep 11 — 8:30 AM EST: Initial Jobless Claims: Monitors whether the labour market strength seen in NFP is sustained; a rise in claims above 240K would partially offset the hawkish NFP narrative.
- Friday, Sep 12 — 10:00 AM EST: University of Michigan Consumer Sentiment & Inflation Expectations (Preliminary): Long-term inflation expectations embedded in the survey carry signal for Fed forward guidance; elevated expectations reinforce the rate-hike scenario for gold bears.
- Sep 15–16: FOMC Rate Decision: The terminal event for gold this week. Markets now price a 60% probability of a hike; any guidance shift in either direction will define gold’s next directional move.
For the full weekly macro framework and key levels across this week’s calendar, see the Gold Compass Daily Week Ahead: September 7–11. Yesterday’s analysis — covering gold’s slide on thin Labor Day volume — is available at Gold Slides to $4,429 as Dollar Firms on Holiday Thin Volume.
London Session Update
Price Check
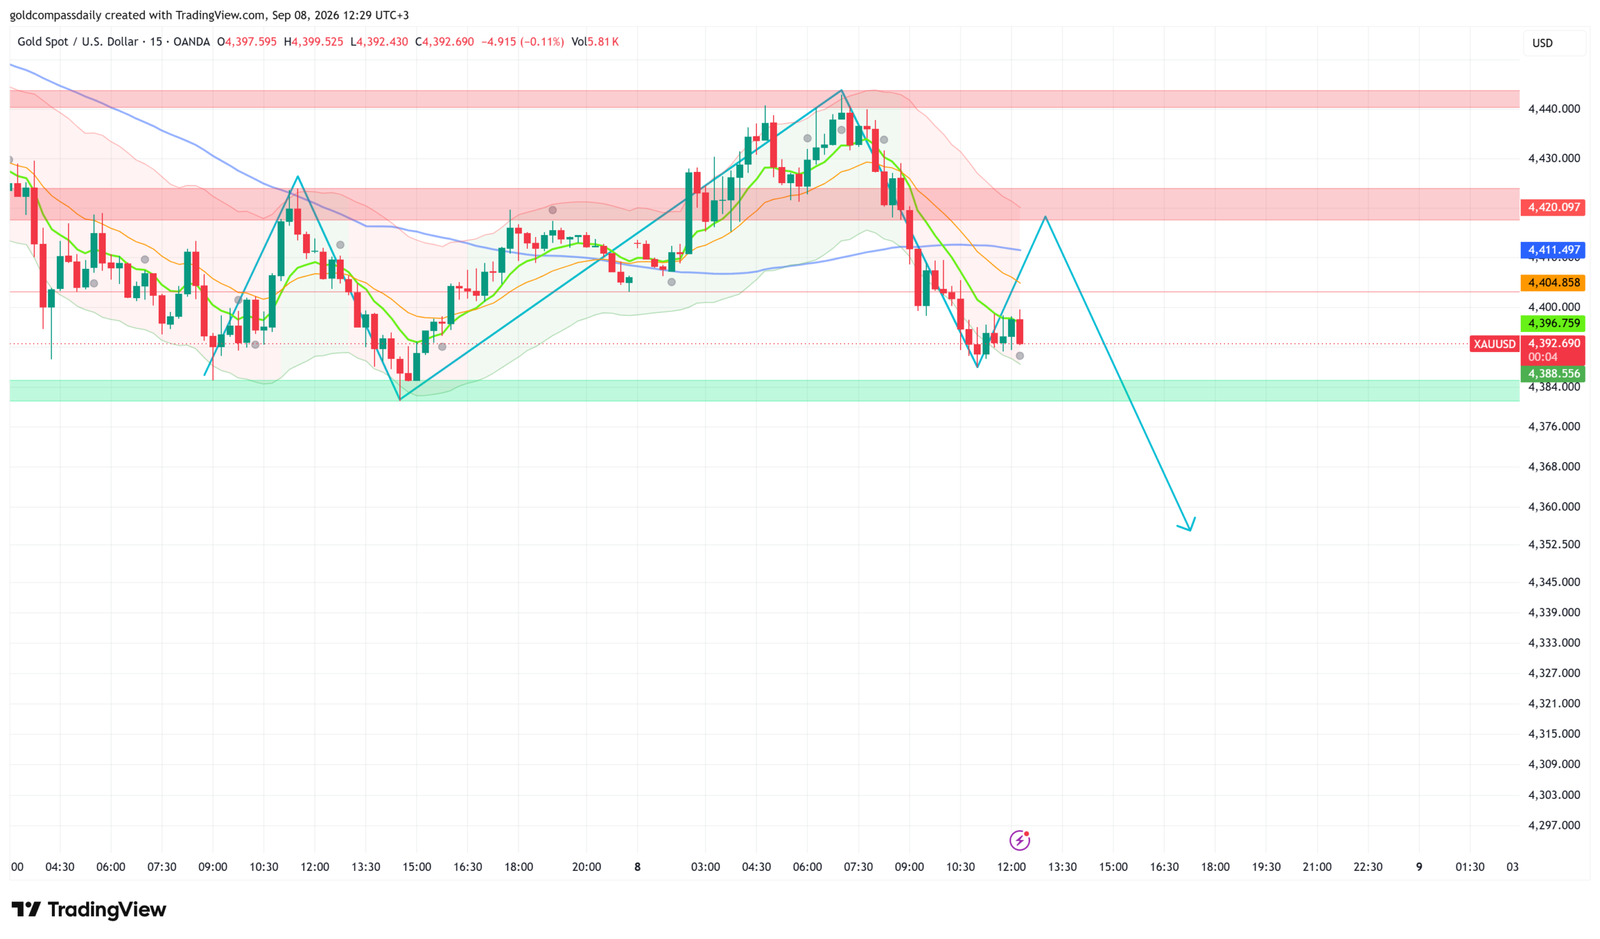
Gold trades at $4,392 as of 12:29 UTC+3, down approximately $30 from the morning analysis price of $4,423 — the sell bias outlined in Gold Compass Daily’s morning analysis has been fully validated. Price rejected from the $4,420–$4,430 resistance zone as projected and is now searching for footing just above the primary green support band at $4,384–$4,388.
What Changed
The London session delivered the breakdown the morning structure was flagging. After a brief early push toward the $4,437–$4,440 zone — where the chart’s cyan projection anticipated a final bull trap — sellers stepped in aggressively into the London fix, driving price through the $4,420 pink resistance band and accelerating lower through $4,404. The move confirmed that the $4,420–$4,430 area is now firmly overhead resistance, not a consolidation base. No major European data releases altered the macro narrative; the session’s pressure was driven by continued dollar strength in the wake of Friday’s NFP beat and position-squaring ahead of Wednesday’s CPI. DXY held its post-NFP gains, keeping the rate-hike premium priced into the dollar and the ceiling on gold intact.
Updated Levels
- Current price: $4,392
- Bias now: Bearish — unchanged, confirmed by London price action
- Updated support: $4,384 → $4,355
- Updated resistance: $4,404 → $4,420
- London session target: $4,384 (on continued dollar bid into NY open)
Scenarios into the NY Handoff
Bull: A sustained reclaim of $4,404 on the NY open, combined with a softer NFIB print below 99.0, reopens a bounce toward $4,420 — but does not change the broader bearish structure.
Bear: Failure to hold $4,384 on the first NY test triggers an extension toward $4,355, consistent with the chart’s projected path and the broader post-NFP repricing.
Chart Analysis
The 15-minute chart (OANDA, UTC+3) shows a clean bearish sequence playing out exactly as the morning structure implied. Price formed a lower high at $4,440 during the early Asian session, then rejected sharply through the $4,420 pink resistance band — which is now confirmed overhead resistance — and has since broken below both short-term moving averages, which have crossed bearishly. The blue longer-term moving average sits at approximately $4,411 and is sloping downward, acting as dynamic resistance on any bounce attempt. Current price at $4,392 is hovering just above the green support band at $4,384–$4,388, which has held on an initial test. The chart’s cyan projection arrow points to a relief bounce toward the $4,404–$4,411 zone before a resumption lower toward the $4,355–$4,360 area — a move that would represent a full retest of last week’s post-crash lows. The structure of lower highs and lower lows from the September 4 peak remains intact; no technical evidence supports a trend reversal at current levels.
New York Session Update
Price Check
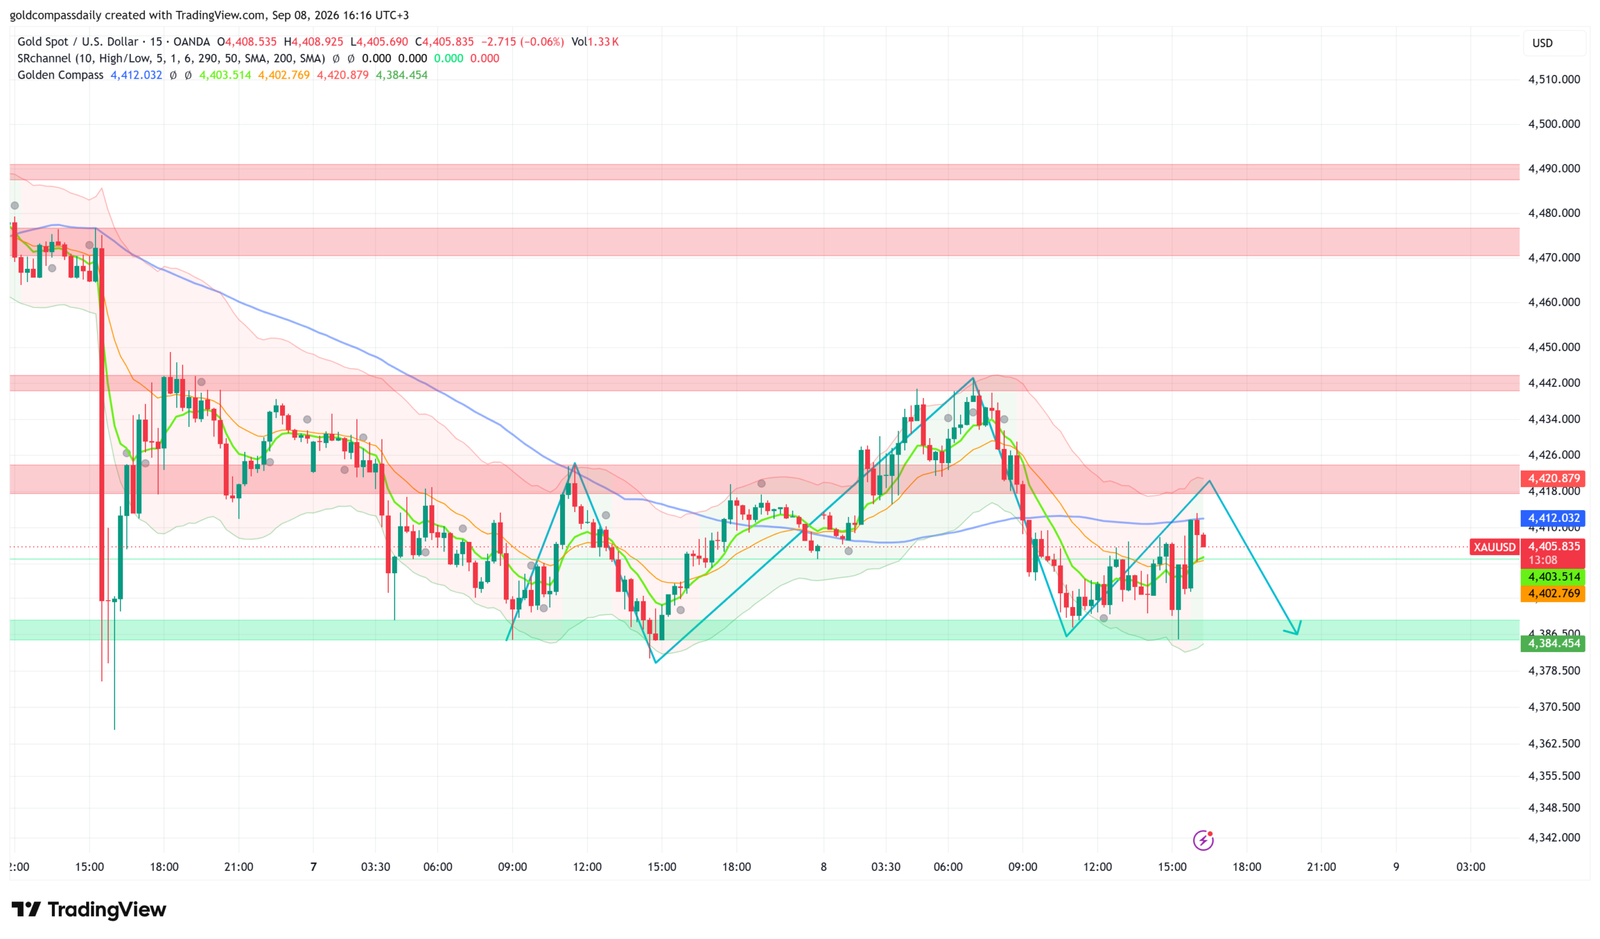
Gold trades at $4,405 as of 16:16 UTC+3, holding inside a tightening descending channel that has contained price action since the London session breakdown. Gold Compass Daily’s morning sell bias remains intact — the $4,420–$4,426 resistance band has rejected every recovery attempt through the NY open, and the structure of lower highs and lower lows continues without interruption.
What Changed
The NY open brought no fundamental catalyst to disrupt the bearish structure. The NFIB Small Business Optimism Index printed at 99.4, in line with the forecast and marginally below September’s prior reading of 99.8 — not weak enough to meaningfully erode the post-NFP dollar bid, but also not a fresh bullish dollar catalyst. Price action since the London handoff has been a compression: gold tested the $4,384 green support band for a second time during the early NY session, held, and has since traced a shallow recovery back toward $4,405–$4,410. The recovery has the character of a relief bounce inside a channel, not a trend reversal — volume remains thin at 1.33K on the current 15-minute bar, and no buying conviction has emerged to challenge the $4,420 ceiling.
Updated Levels
- Current price: $4,405
- Bias now: Bearish — unchanged; descending channel intact, $4,420 capping all bounces
- Updated support: $4,384 → $4,355
- Updated resistance: $4,412 → $4,420–$4,426
- NY session target: $4,384 (retest of channel floor into the close)
Scenarios into the Close
Bull: A sustained break and close above $4,426 on meaningful volume shifts the channel structure neutral and opens a move toward $4,442 — but does not reverse the day’s bearish thesis ahead of Wednesday’s CPI.
Bear: Rejection from the current $4,405–$4,412 area and a break below $4,384 confirms the channel breakdown, targeting $4,355 into the Asian session open.
Chart Analysis
The 15-minute chart (OANDA, UTC+3) shows gold locked inside a well-defined descending channel, with the upper boundary running through $4,420–$4,426 and the lower boundary at the $4,384 green support band. Price has double-tapped $4,384 without a clean break — a temporary floor — but the structure offers no evidence of accumulation. The blue 200 SMA is declining sharply from the $4,430s toward $4,420, reinforcing that zone as the dominant overhead barrier. Short-term moving averages (yellow/orange) are flat and converging just below $4,412, consistent with a pause inside a downtrend rather than a reversal. The Golden Compass indicator reads $4,420 as the key pivot: price below it confirms the bear case, above it opens a short-term neutral window. The chart’s cyan projection anticipates one more push toward $4,412–$4,416 before the channel reasserts and drives price back to the $4,384 floor — a clean retest that, if broken, projects the next leg toward $4,355. The morning and London analyses’ levels require no revision; the structure has played out as mapped.
New York Close & Asian Session Outlook
NY Close
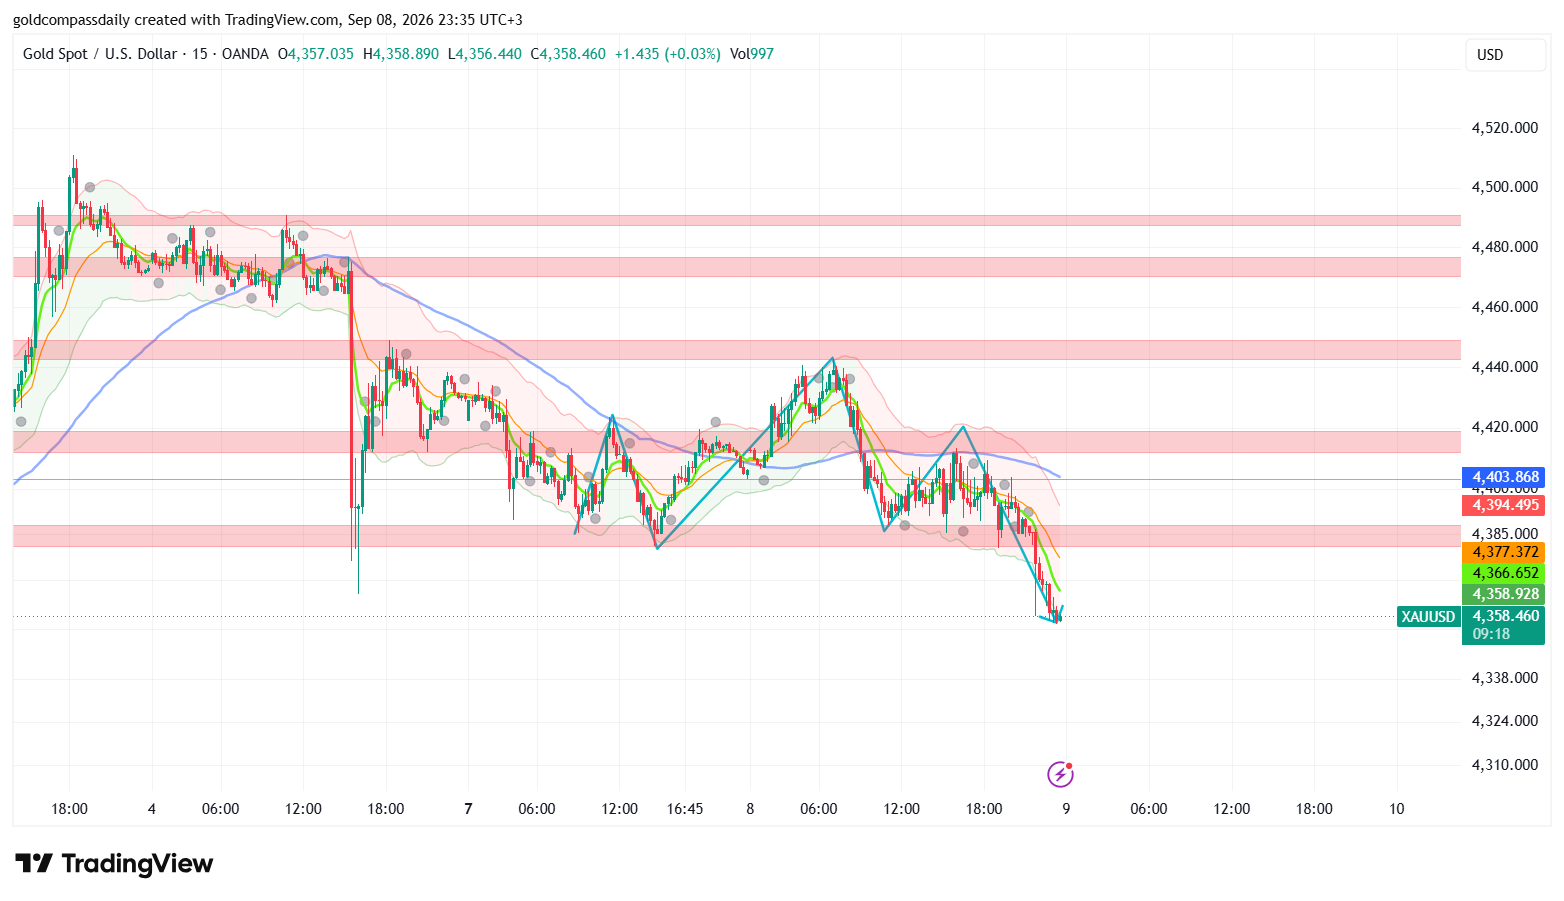
Gold closed the New York session at $4,358 — firmly bearish — fully confirming the sell bias Gold Compass Daily’s morning analysis established at $4,423. From the opening resistance test at $4,430 through the London breakdown, the NY channel compression, and finally the late-session acceleration lower, price delivered a clean $65 decline across the full session. The $4,384 green support band, which held through two London tests and the early NY session, was broken decisively into the close — flipping to resistance and opening a new leg lower.
Updated Key Levels
- NY Close: $4,358
- Session high: $4,442 / Session low: $4,356
- Bias into Asian session: Bearish below $4,384
- Asian session support: $4,355 → $4,320
- Asian session resistance: $4,366 → $4,377 → $4,394 → $4,404
Chart Read at Close
The 15-minute chart (OANDA, UTC+3) shows price closing at the session low with no meaningful wick beneath — sellers held control through the final candle with no buyer response. All short-term moving averages (yellow, orange, green) are steeply declining and stacked above price, offering no dynamic support. The blue 200 SMA sits near $4,404, a level that now represents major overhead resistance rather than a base. Price has pushed through the lower Bollinger Band — a condition that typically resolves with either a brief consolidation or a volatility expansion lower; given the absence of any demand zone visible on the chart below $4,355, the balance of risk favours continuation. The cyan projection arrow confirms the market’s own read: a shallow dead-cat bounce before the next leg lower. The dotted structural level at $4,355–$4,358 is the only identifiable near-term floor, and price is testing it at the close.
Asian Session Outlook
The Asian session (00:00–09:00 UTC+3) is expected to open with a brief consolidation around the $4,355–$4,366 zone as liquidity thins. The most probable scenario is a shallow recovery toward $4,377–$4,384 — a sweep of sell-side liquidity and a retest of the broken green support band, now acting as resistance — before sellers reassert ahead of the London open. A sustained bid through $4,384 into the Asian close would be the first structural signal that the day’s sell-off is exhausting; absent that, the path of least resistance into Wednesday’s CPI release remains lower, with $4,320 as the extended bear target.
Wednesday Bull / Bear Scenarios
Bull trigger: Asian session holds $4,355 and reclaims $4,384 on a 15-minute close, then London confirms above $4,394 → recovery toward $4,420, with CPI upside surprise required to extend further.
Bear trigger: Failure to reclaim $4,366 during Asian session, or a CPI print at or above forecast on Wednesday → continuation toward $4,320, with $4,280 as the extended target on a hot inflation read.
Tomorrow’s Key Events
- All day — Wednesday, Sep 9: Pre-CPI positioning — expect compressed ranges and potential liquidity sweeps in both directions as traders square positions ahead of the data; gold volatility typically compresses then spikes sharply on the print.
- 14:30 UTC+3 — US CPI (August, forecast TBC): The week’s primary catalyst for gold. A print at or above expectations confirms the Fed’s tightening case and opens $4,280–$4,300; a miss below 2.8% YoY reopens $4,420 and potentially $4,480 on a sharp unwind of rate-hike positioning.
- 16:30 UTC+3 — US CPI (Core, August): Core CPI carries more weight for Fed forward guidance than headline; a sticky core reading above 3.2% YoY would be the most bearish outcome for gold regardless of the headline print.
Analysis based on the XAU/USD 15-minute chart as of September 8, 2026, 08:26 AM UTC+3. This article is for informational and educational purposes only and does not constitute financial advice.