

Market Snapshot
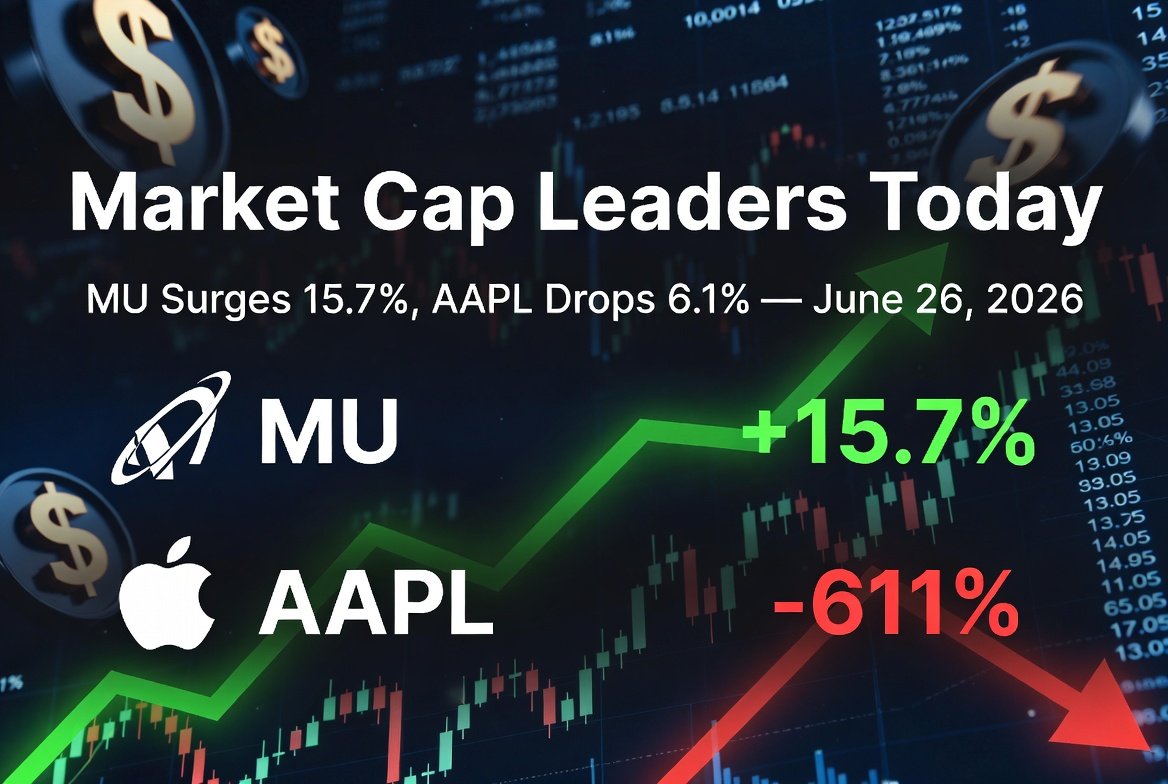
Technology dominates today’s mega-cap action with a broadly negative bias, as Apple (AAPL) leads declines among the largest names with a 6.1% single-session drop, while Micron Technology (MU) stands as the session’s most notable outlier, surging 15.7% to $1,213.56 against the prevailing trend. Meta Platforms (META) and Microsoft (MSFT) both register meaningful declines of 2.6% and 3.5% respectively, reinforcing the broad pressure across software and hardware mega-caps, while select semiconductor names — MU, AMAT, and LRCX — move sharply in the opposite direction.
Top Market Cap Leaders — Price Action
- NVDA (NVIDIA): $4.74T market cap, $195.74 (−1.6% today) — the largest name by market cap pulls back modestly.
- GOOGL (Alphabet): $4.19T market cap, $343.71 (−0.5% today) — contained decline relative to broader mega-cap weakness.
- AAPL (Apple): $4.04T market cap, $275.15 (−6.1% today) — the session’s largest percentage decline among the top ten by market cap.
- MSFT (Microsoft): $2.62T market cap, $352.83 (−3.5% today) — notable intraday pressure in the software and IT services segment.
- AMZN (Amazon): $2.44T market cap, $227.01 (−3.1% today) — Consumer Cyclicals classification; moves broadly in line with tech-adjacent pressure.
- SPCX: $2.02T market cap, $153.00 (−1.0% today) — Telecommunications industry; negative trailing P/E of −52.1x flags absence of current earnings.
- AVGO (Broadcom): $1.80T market cap, $378.91 (−0.8% today) — mild decline in semiconductors; P/E of 63x noted.
- TSLA (Tesla): $1.41T market cap, $375.12 (−0.1% today) — effectively flat on the session; P/E of 343.1x and PEG of −10.34 stand as the most extreme valuation readings in the dataset.
- META (Meta Platforms): $1.38T market cap, $542.87 (−2.6% today) — Software & IT Services; P/E of 19.9x is among the most moderate in the technology cohort.
- MU (Micron Technology): $1.37T market cap, $1,213.56 (+15.7% today) — the session’s strongest performer across the entire dataset; P/E of 56.2x with a PEG of 0.13 suggests growth is running well ahead of the earnings multiple.
- BRKa (Berkshire Hathaway): $1.05T market cap, $733,400 (−1.3% today) — Consumer Non-Cyclicals; P/E of 14.5x represents one of the lower multiples among trillion-dollar names.
- LLY (Eli Lilly): $1.01T market cap, $1,127.69 (+0.9% today) — one of the few mega-cap names trading higher today; P/E of 40.2x with a PEG of 0.3 in Pharmaceuticals.
- WMT (Walmart): $921.93B market cap, $115.78 (−2.7% today) — Food & Drug Retailing; P/E of 40.9x with PEG of 1.92.
- JPM (JPMorgan Chase): $897.96B market cap, $335.12 (+0.5% today) — Banking Services common shares show a modest gain; P/E of 16.1x with PEG of 6.33.
- AMD (Advanced Micro Devices): $868.41B market cap, $532.57 (+2.5% today) — second-strongest performer in the top 20 by market cap; P/E of 174.4x.
Valuation Read
Several names in the dataset carry valuation readings that stand out relative to the broader cohort. Tesla (TSLA) trades at a trailing P/E of 343.1x — the highest in the dataset by a significant margin — paired with a PEG ratio of −10.34, which reflects negative growth expectations embedded in consensus estimates on a trailing basis. SPCX carries a negative P/E of −52.1x, indicating the company does not currently report positive trailing earnings; the metric is presented factually and does not imply a directional view. AMD trades at 174.4x trailing earnings, while INTC carries a negative P/E of −192.9x, also flagging an absence of trailing profitability. Broadcom (AVGO) at 63x, AMAT at 61.2x, and LRCX at 74.2x represent elevated semiconductor multiples concentrated in a single industry vertical.
On the opposite end, Berkshire Hathaway (BRKa) at 14.5x and JPMorgan Chase (JPM) at 16.1x trade at notably more compressed multiples relative to the technology-heavy top of the list. Micron (MU) presents the most compelling PEG reading in the dataset at 0.13, suggesting that at a P/E of 56.2x, growth projections embedded in consensus estimates are running at a significantly faster rate than the earnings multiple alone implies — a reading that may partly explain the stock’s outsized session move. Eli Lilly (LLY) at a PEG of 0.3 and Amazon (AMZN) at 0.8 also register growth-adjusted multiples that sit well below the face value of their headline P/E ratios.
Analyst Target Divergence
Among the names with visible analyst target upside data, Microsoft (MSFT) carries the largest implied upside in the top ten by market cap, with analyst consensus implying 57.3% upside from current levels — notable given the stock is down 3.5% on the session, widening the gap between current price and consensus target. Meta Platforms (META) shows analyst consensus implying 52% upside, while Oracle (ORCL) at 58.1% upside represents one of the largest divergences in the extended list. NVDA analyst consensus implies 44.7% upside from $195.74, and Amazon (AMZN) shows 38.8% implied upside — both suggesting the current price levels sit meaningfully below where the analyst community has set its aggregate price targets.
On the downside, Intel (INTC) stands as the most notable outlier: analyst consensus implies −32.3% downside from current levels, meaning the aggregate price target sits approximately one-third below the current trade price of $132.87. Applied Materials (AMAT) shows −21.4% implied downside, and Lam Research (LRCX) shows −17.6% implied downside — both also in Semiconductors. AMD registers −6.1% implied downside, a relatively modest figure but still representing a consensus target below current price following a 2.5% session gain. These readings indicate that analyst community expectations for several semiconductor names are currently positioned below prevailing market prices.
Sector Concentration
Of the 30 names listed in this dataset, a significant majority — roughly 16 to 18 depending on classification — fall under the Technology sector, with Semiconductors & Semiconductor Equipment alone accounting for NVDA, AVGO, MU, AMD, INTC, AMAT, and LRCX. This degree of concentration in a single sector and industry means that index-level performance for the largest U.S. equities is heavily dependent on semiconductor and software name performance. A broad repricing event within the Technology sector — as partially evidenced by today’s session, where AAPL falls 6.1% and MSFT drops 3.5% — carries disproportionate index weight relative to equivalent moves in Healthcare, Financials, Energy, or Industrials names that appear lower in the market cap ranking.
What to Watch
Intel (INTC) presents the most pronounced divergence in the dataset: trading at $132.87 with analyst consensus implying −32.3% downside, the stock carries a negative trailing P/E of −192.9x, signaling an absence of current earnings while the price remains well above the aggregate analyst target — a combination that warrants continued monitoring. Separately, Micron (MU) surging 15.7% on a session where the majority of semiconductor peers are flat to lower, paired with a PEG of 0.13 and 23.4% analyst upside still implied above even today’s elevated close, represents a notable divergence between price momentum and the broader tape.
Market Update — Afternoon Session
What Changed
The leadership picture among mega-cap names has shifted in several meaningful ways since Gold Compass Daily’s earlier report. The broad negative bias has partially eased, with Apple (AAPL) reversing from a −6.1% session low to trade +0.4%, and Microsoft (MSFT) flipping from −3.5% to +3.1% — two of the most consequential moves in the updated data. Micron (MU), which led the session earlier with a +15.7% surge, has pulled back to −5.5%, removing the day’s standout gainer from the positive column entirely.
New or Changed Movers
- AAPL (Apple): $276.33 (+0.4%) — reversed sharply from the −6.1% decline reported earlier; the catalyst for the reversal was not confirmed in available data.
- MSFT (Microsoft): $363.66 (+3.1%) — flipped from a −3.5% loss in the earlier report to a meaningful gain; no confirmed catalyst provided.
- MU (Micron Technology): $1,146.40 (−5.5%) — the session’s top gainer at +15.7% in the morning report has reversed course entirely and now registers as one of the larger decliners in the top 30 by market cap.
- AMD (Advanced Micro Devices): $512.43 (−3.8%) — was trading +2.5% in the earlier snapshot; the reversal into negative territory is a notable directional shift, with market cap contracting to $836.79B.
- AMZN (Amazon): $227.38 (+0.2%) — was down 3.1% in the morning report; effectively flat now but the directional flip is notable.
- META (Meta Platforms): $543.20 (+0.1%) — recovered from a −2.6% loss reported earlier; fractionally positive but the reversal confirms broad recovery pressure in software mega-caps.
- AMAT (Applied Materials): $633.45 (−5.2%) — deepened its decline from the morning session; analyst consensus continues to imply −21.4% downside from current levels.
- LRCX (Lam Research): $378.01 (−5.9%) — similarly extended losses versus the earlier report; analyst consensus implies −17.6% downside.
- INTC (Intel): $127.54 (−4.0%) — extended the decline from the earlier session; the −32.3% analyst downside implied and negative trailing P/E of −192.9x remain in place.
- CAT (Caterpillar): $1,014.72 (−4.0%) — increased its loss versus the earlier snapshot; no confirmed catalyst provided.
- V (Visa): $335.90 (+1.6%) — moved into a more meaningful gain versus the earlier report where it was down 0.5%; one of the stronger performers in the updated data outside of MSFT.
- JNJ (Johnson & Johnson): $251.92 (+2.9%) — accelerated from +1.6% in the morning report; Healthcare showing relative strength in the updated session.
- MA (Mastercard): $497.72 (+1.8%) — was down 1.1% in the earlier report; the reversal into positive territory mirrors Visa’s move and points to intraday recovery in the Financials/Payments segment.
Names That Held Their Position
NVDA, GOOGL, SPCX, AVGO, TSLA, BRKa, WMT, JPM, and XOM broadly maintained their directional bias from the morning report, with moves of smaller magnitude, confirming that the session’s most notable story has been the sharp reversals in AAPL, MSFT, MU, and AMD rather than continuation in the names that held their trend.
Updated Sector Read
The semiconductor narrative has split decisively in the afternoon session. Where the morning report identified divergence — MU surging while peers declined — the updated data shows that divergence collapsing: MU has given back most of its gains and now trades −5.5%, while AMAT and LRCX have extended their losses to −5.2% and −5.9% respectively, and INTC deepens to −4.0%. AMD, which had been a secondary bright spot at +2.5% in the morning, now trades −3.8%. The semiconductor segment is uniformly under pressure in the updated session. The partial offset comes from Software & IT Services, where MSFT’s +3.1% reversal and META’s recovery represent the more constructive side of the Technology sector tape, though the net picture across Technology as a whole remains mixed-to-negative. Outside Technology, Healthcare (JNJ +2.9%, LLY +4.6%) and the Payments segment (V +1.6%, MA +1.8%) are among the stronger-performing pockets in the updated data.
Into the Close
Micron’s sharp intraday reversal from +15.7% to −5.5% — a swing of more than 20 percentage points — warrants monitoring into the close, as does whether MSFT and AAPL can sustain their afternoon recoveries given the magnitude of their earlier declines. The uniform deterioration across semiconductor equipment names (AMAT, LRCX) alongside INTC’s continued weakness suggests the sector faces persistent selling pressure that has not yet resolved.
Data based on market capitalization, valuation metrics, and analyst targets as of June 26, 2026. This article is for informational and educational purposes only and does not constitute financial advice.