
Gold trades on hold at $4,306 on Monday — caught between a recovering technical structure and a macro calendar that doesn’t heat up until mid-week. With no high-impact US data scheduled today and a light European docket, the session is unlikely to provide directional conviction. The path of least resistance points toward a dip toward the $4,120–$4,138 demand zone before any meaningful recovery attempt, with Wednesday’s US CPI release serving as the week’s defining catalyst.
Key Levels
- Bias: Neutral — hold below $4,330
- Support: $4,309 → $4,268 → $4,120–$4,138
- Resistance: $4,330 → $4,366 → $4,382
- Session target: $4,268–$4,309 consolidation (conditional on no USD catalyst)
- Invalidation: Below $4,065 = deeper structural breakdown toward $3,997
Catalyst of the Day
The Eurozone Sentix Investor Confidence print at 11:30 AM (UTC+3) is the day’s highest-impact scheduled release, with consensus at -13.8 versus a prior reading of -16.4. An improvement would signal reduced safe-haven demand in Europe, a mild headwind for gold. German Factory Orders at 9:00 AM printed at -3.8% versus the -2.2% forecast — a soft industrial reading that modestly supports the gold demand narrative via broader risk-off positioning. Neither release is a primary mover, but the German miss reinforces the case for ECB easing on Thursday, which remains the week’s second-largest macro event for XAU/USD.
Fundamental Context
Gold’s pullback from the $4,490 range highs in late May reflects a repricing of near-term risk rather than a structural shift in the bullish case. The US dollar has stabilized following last Friday’s NFP print, reducing the acute pressure on gold that the payrolls beat initially generated. With the $4,430 support zone broken on Friday, the market is now searching for a credible floor before committing to the next directional leg.
Wednesday’s US CPI release carries outsized weight this week. A softer-than-expected print would revive FOMC rate cut expectations, weakening the dollar and providing the fundamental trigger for gold to bottom and recover toward $4,366–$4,382. A hotter print, by contrast, would reinforce the Fed’s higher-for-longer stance and accelerate selling pressure toward the $4,120 demand zone identified on the 4H chart. Thursday’s ECB rate decision adds a second layer: a dovish cut combined with a weak forward guidance tone could briefly pressure the euro while simultaneously supporting gold via global liquidity expectations. The full macro framework for the June 8–12 week is outlined in the Gold Compass Daily weekly hub.
Chart Analysis
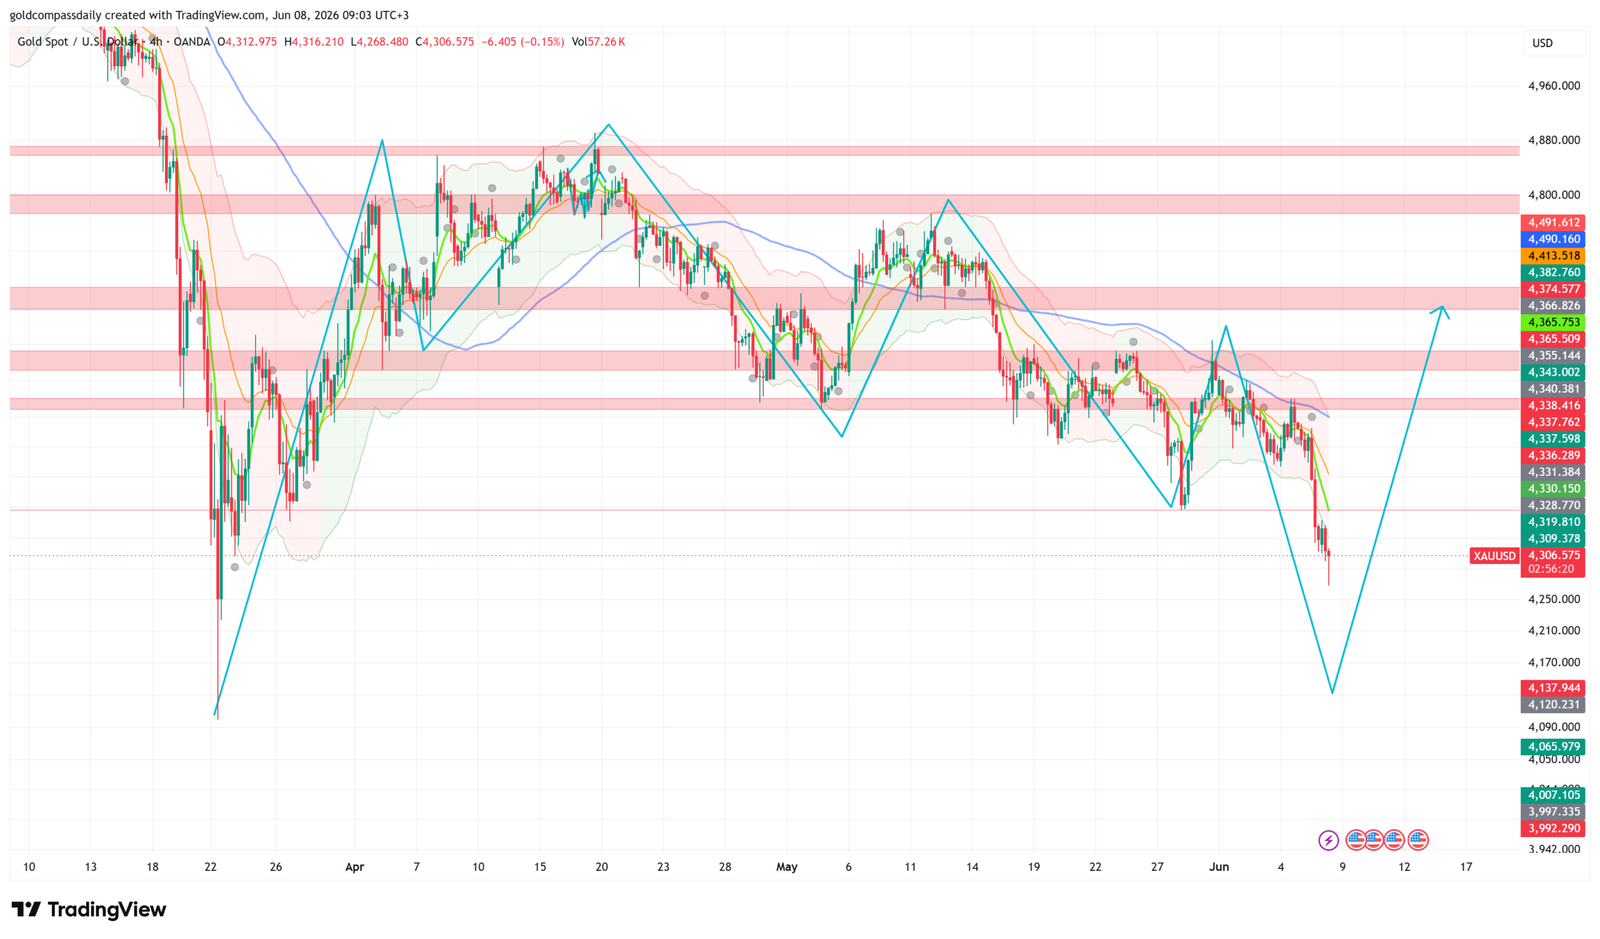
The 4H chart shows XAU/USD printing at $4,306 after a sharp breakdown from the $4,330–$4,340 consolidation range that held through late May and early June. Price has sliced through the green and yellow short-term moving averages, with the blue 200-period MA now sloping downward at approximately $4,366 — acting as a dynamic resistance ceiling rather than a support structure. Bollinger Bands are expanded with price pressing the lower band, consistent with bearish momentum rather than a compression setup. The chart’s projected path (teal arrow) shows a continuation toward the $4,120–$4,138 demand zone before a recovery attempt — a structure that mirrors the April V-shaped recovery from the sub-$4,200 lows. The $4,309 level (lower chart marker) is the nearest horizontal reference; a 4H close below it on volume opens the direct path to $4,268 and subsequently $4,120. A recovery above $4,330 on a 4H close would be the first signal that the flush has completed.
Bull / Bear Scenarios
Bull Trigger
A 4H candle close above $4,330 — ideally following a successful retest of $4,268–$4,309 as support — opens a recovery toward $4,366, with an extended target of $4,382 if CPI prints soft on Wednesday. This would constitute a classic demand-zone reclaim following a false breakdown.
Bear Trigger
A 4H close below $4,268 without a wick recovery confirms the continuation structure toward $4,138–$4,120. If that zone also fails to hold on a closing basis, the next structural support sits at $4,065, with a deeper flush toward $3,997 possible before end of week.
Events Ahead
- Mon Jun 9 — 11:30 AM UTC+3 — Eurozone Sentix Investor Confidence (forecast -13.8): Improvement reduces safe-haven bid; miss supports gold.
- Wed Jun 11 — 15:30 UTC+3 — US CPI m/m & y/y (TBC): Primary catalyst of the week — determines Fed rate cut trajectory and dollar direction.
- Thu Jun 12 — 15:15 UTC+3 — ECB Rate Decision: Dovish pivot or softer forward guidance could support global liquidity narrative and gold recovery.
- Thu Jun 12 — 15:30 UTC+3 — US Initial Jobless Claims: Secondary labor market read — elevated claims would add to gold’s bullish fundamental case.
- Fri Jun 13 — 15:30 UTC+3 — US PPI m/m: Inflation follow-through data — reinforces or contradicts Wednesday’s CPI signal for gold.
London Session Update
Price Check
Gold is holding at $4,300 as the London session progresses — the morning’s hold bias remains intact, with price yet to commit to a directional break in either direction.

What Changed
The London open brought a test of $4,320, a level not explicitly flagged in the morning analysis but now confirmed as active intraday resistance following a clear rejection. The failed push has crystallised a short-term range structure between $4,250 and $4,350, with European participants showing little appetite to extend beyond either boundary ahead of Wednesday’s US CPI. German Factory Orders, which printed well below forecast at -3.8%, added a mild risk-off tone to the session but insufficient to provide directional follow-through for gold.
Updated Levels
- Current price: $4,300
- Bias now: Neutral — unchanged, range-bound between $4,250–$4,350
- Updated support: $4,268 → $4,250
- Updated resistance: $4,320 → $4,350
- NY session target: $4,268–$4,309 consolidation
Scenarios Into the Close
Bull: A 4H close above $4,320 opens a move toward the $4,350 channel top ahead of Wednesday’s CPI catalyst.
Bear: A 4H close below $4,268 reinstates the downside projection toward the $4,120–$4,138 demand zone identified in the morning analysis.
Chart Analysis
The 4H chart shows price consolidating in the middle of the newly defined $4,250–$4,350 channel, with short-term moving averages converging and flattening around $4,310–$4,330 — a classic compression signal ahead of a macro event. The $4,320 rejection printed a visible upper wick, confirming supply at that level. The 200-period MA continues to slope downward above current price, keeping the broader structure bearish. A sustained hold above $4,300 through the New York open would be the minimum requirement for a bullish channel development; failure to hold opens a drift toward $4,268.
New York Session Update
Price Check
Gold has recovered sharply to $4,332 as the New York session opens — a significant reversal from the morning’s sub-$4,310 lows and broadly supportive of the morning’s buy thesis, which projected a demand-zone bounce before any directional resolution.

What Changed
The 15-minute chart tells the session’s story clearly: a capitulation wick printed at approximately $4,274 during the early London session, establishing a clean intraday low before an aggressive V-shaped recovery carried price back through $4,320 and into the current $4,330 area. The bounce has been steep and fast, suggesting institutional absorption at the lower demand zone. Price is now pressing against the $4,321–$4,328 supply cluster visible on the right-side levels, and the projected path on the chart points toward a retest of the $4,380–$4,383 resistance band followed by a potential continuation toward $4,460–$4,480 over the coming sessions.
Updated Levels
- Current price: $4,332
- Bias now: Cautiously bullish — V-shaped recovery from $4,274 demand zone shifts intraday bias higher
- Updated support: $4,319 → $4,288 → $4,274
- Updated resistance: $4,338 → $4,366 → $4,383
- NY session target: $4,366 on a sustained hold above $4,328
Scenarios Into the Close
Bull: A 15-minute close and hold above $4,338 confirms the recovery structure and targets $4,366–$4,383 into the New York close.
Bear: Failure to hold $4,319 on a pullback invalidates the V-shaped recovery and reopens a retest of the $4,288–$4,274 demand zone.
Chart Analysis
The 15-minute chart shows a textbook intraday capitulation and recovery: price sold off aggressively from the $4,470 area through the London open, accelerating into a spike low near $4,274 before reversing sharply. The green demand band between $4,274 and $4,288 held cleanly, with the recovery candles reclaiming the short-term moving average stack — green and yellow MAs are now curling upward beneath price, a bullish realignment. Bollinger Bands are beginning to contract after the expansion on the downswing, consistent with a momentum reset. The chart’s projected path (teal arrow) shows a consolidation near $4,320–$4,330 before a push toward $4,460–$4,480, contingent on no adverse macro developments before Wednesday’s CPI.
Analysis based on the XAU/USD 4H chart as of June 8, 2026, 09:03 UTC+3. This article is for informational and educational purposes only and does not constitute financial advice.