

Gold trades cautiously bullish at $4,016 on Friday, June 26, attempting to consolidate above a critical support cluster following four days of heavy selling pressure. The immediate driver is the afternoon release of Revised University of Michigan Consumer Sentiment and Inflation Expectations — data that will either validate or undermine the modest recovery structure forming on the 15-minute chart. A clean hold above $4,012 keeps the recovery path toward $4,045–$4,065 intact.
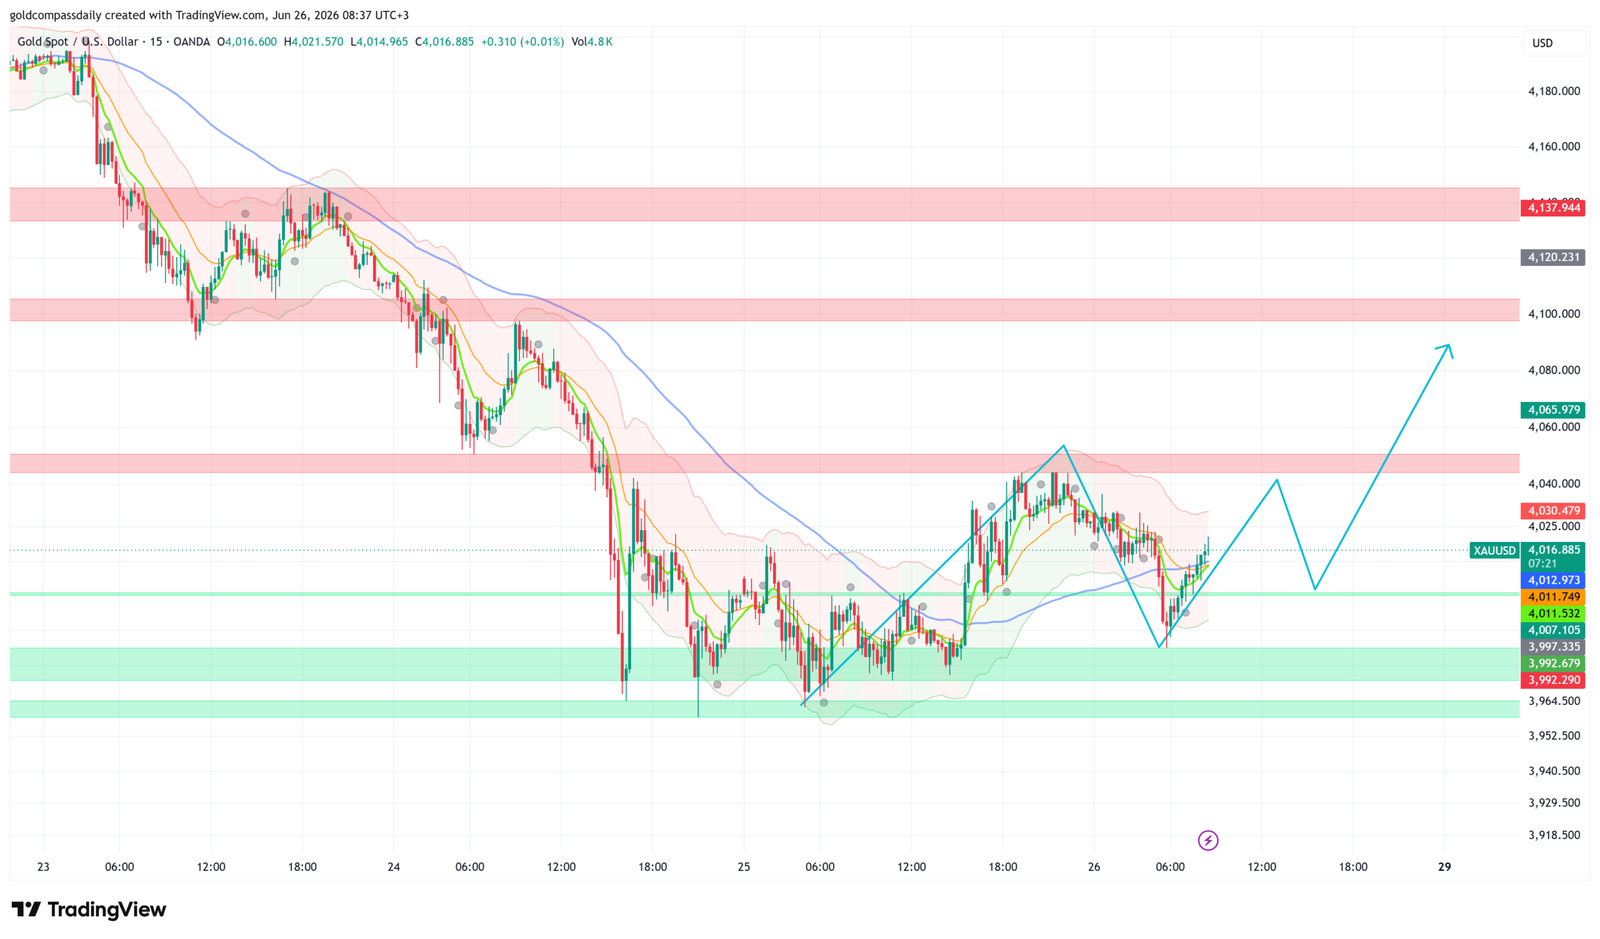
Key Levels
- Bias: Cautiously Bullish above $4,012
- Support: $4,007 → $3,992–$3,997 (green demand zone) → $3,964 (week low)
- Resistance: $4,030 → $4,045 → $4,065 → $4,100
- Session target: $4,065 (conditional on UoM sentiment miss and dollar softness)
- Invalidation: Below $3,992 = recovery thesis collapses; bears re-target $3,964
Catalyst of the Day: UoM Consumer Sentiment and Inflation Expectations (5:00 PM)
The single most important release for gold this session is the Revised University of Michigan Consumer Sentiment (forecast: 50.0 vs prior 48.9) and the accompanying Revised UoM Inflation Expectations (prior: 4.6%). For gold, the inflation expectations component carries the sharper edge. A reading that holds elevated — at or above 4.6% — reinforces the case for the Fed to proceed with rate hikes before year-end, strengthening the dollar and compressing gold’s recovery. A downside surprise in either headline sentiment or inflation expectations would reduce hike probability, weaken the dollar, and give gold the catalyst it needs to clear $4,030 and press toward $4,065. FOMC Member Kashkari speaks at 6:30 PM; any language signaling openness to further tightening would act as a secondary headwind for the metal in the final hour of the week.
Fundamental Context
Gold is heading for a fourth consecutive weekly loss, pressured by a combination of a resurgent US dollar and repriced Federal Reserve rate expectations. The Fed held rates steady at its June meeting, but headline CPI ran at 4.2% year-on-year in May 2026, driven by energy costs up 23.5% following the Middle East conflict shock, keeping the door firmly open for at least one further rate hike before year-end. Fed funds futures markets are pricing in an 87% probability of a December rate hike, which has been the primary structural weight on gold throughout this correction. Rising real yields and a stronger dollar are the mechanism: gold, as a non-yielding asset, loses relative appeal when the cost of holding cash rises.
The geopolitical dimension that propelled gold to its all-time high near $5,600 in January has materially faded. A 60-day US-Iran peace roadmap has been signed, and Brent crude fell to its lowest level since late February, with vessels transiting the Strait of Hormuz. The easing of the energy shock removes one of the key inflationary arguments that had kept gold supported at higher levels. That said, the same peace process remains fragile. Concerns about the fragile US-Iran peace agreement continue to benefit the safe-haven dollar, limiting the degree to which gold can sustainably rally without a genuine shift in rate expectations. The Goods Trade Balance (3:30 PM) and Prelim Wholesale Inventories data could add incremental dollar volatility ahead of the main UoM release.
Chart Analysis
The 15-minute XAU/USD chart covering June 23–26 shows a textbook breakdown and base-building structure. Price collapsed from the $4,138–$4,100 resistance band on June 23 into a session low near $3,964 on June 24, representing a drop of approximately $175 from the weekly open area. Since the June 25 base, price has constructed a series of higher lows, recovering back above $4,007 and stabilizing around the $4,012–$4,017 zone at the time of writing. The fast EMAs (green and orange) have crossed upward through the slower blue EMA, generating the first bullish MA signal since the selloff began — a short-term constructive signal, though the blue EMA continues to slope downward, confirming the broader intraday trend remains corrective rather than impulsive to the upside. Bollinger Bands show price has migrated from the lower band back toward the midline, consistent with a relief bounce rather than a trend reversal. Immediate resistance sits at $4,030, followed by the $4,065 zone which the chart’s projected path highlights as the next key test. The green support band at $3,992–$3,997 represents the last meaningful defence before the week’s low at $3,964 comes back into play. The projected path drawn on the chart suggests a potential dip back toward $3,997 before a renewed push toward $4,065 and above — a structure that aligns with a buy-the-dip framework contingent on macro data cooperating this afternoon.
Bull / Bear Scenarios
Bull Trigger
UoM Consumer Sentiment prints below 49.0 and/or Inflation Expectations fall below 4.5% → dollar softens → gold clears $4,030 with conviction → immediate target $4,065, extended target $4,100 into the weekly close. Kashkari adopts a neutral tone as a confirming signal.
Bear Trigger
UoM Inflation Expectations hold at or above 4.6% and Sentiment beats 50.0 → dollar firms → gold breaks back below $4,007 → retest of $3,992–$3,997 demand zone → failure there opens $3,964 and potential extension toward $3,929 in early next-week trade.
Events Ahead
- Friday, 3:30 PM — Goods Trade Balance (forecast: -$85.0B): A wider deficit could weigh on the dollar marginally — mild positive for gold.
- Friday, 3:30 PM — Prelim Wholesale Inventories m/m (forecast: 0.3%): Secondary data; watch for dollar reaction.
- Friday, 5:00 PM — Revised UoM Consumer Sentiment (forecast: 50.0) + Inflation Expectations (prior: 4.6%): Primary session catalyst for gold; direction of inflation expectations component is the key variable.
- Friday, 6:30 PM — FOMC Member Kashkari Speaks: End-of-week risk; hawkish commentary would extend gold’s weekly losses into the close.
- Monday, June 29 — Markets re-open; watch for weekend geopolitical developments around US-Iran peace roadmap that could reprice safe-haven demand.
Gold must hold $4,007–$4,012 through the US data window this afternoon. A clean UoM miss delivers the setup for a test of $4,065 before week’s end; a beat reinforces the fourth weekly loss and shifts focus to whether $3,964 holds as the corrective floor heading into the final week of June. For full weekly context, see the Gold Week Ahead: June 23–27 hub. Thursday’s session analysis is available here: XAU/USD Slides to $3,981 Ahead of Core PCE — Bear Pressure Holds.
New York Session Update
Price Check
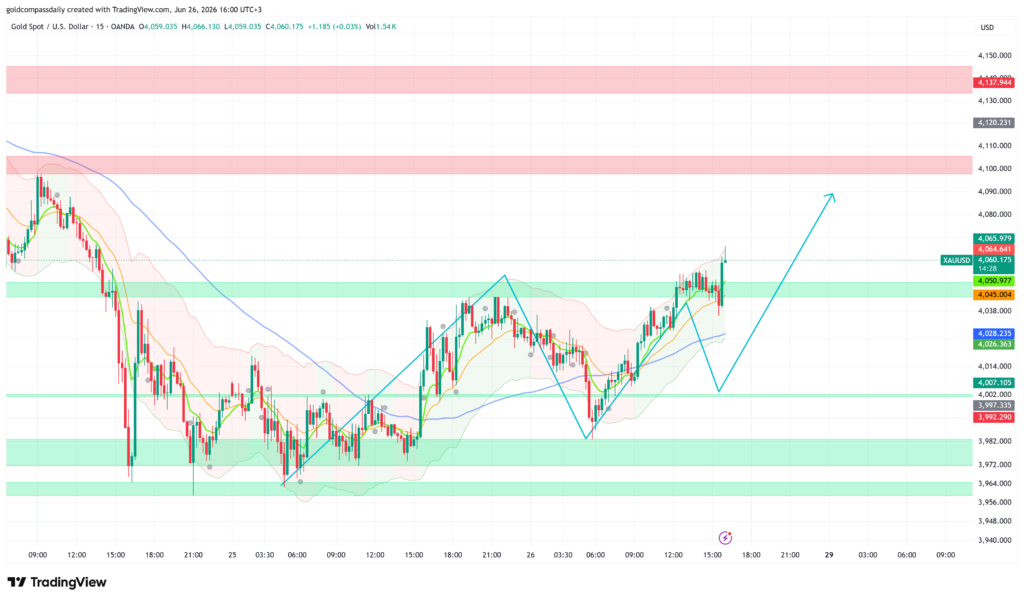
Gold has broken decisively above the morning’s primary resistance target, trading at $4,060 as of the New York afternoon session — a gain of approximately $43 from the $4,016 level at the time of morning publication. The morning buy bias has been confirmed and extended, with price clearing both the $4,030 and $4,045 interim targets in a single sustained move.
What Changed
The catalyst materialized precisely as the morning analysis flagged: the Revised University of Michigan Consumer Sentiment printed at 50.0 while Inflation Expectations held at 4.6% — a result that failed to deliver the hawkish upside surprise the dollar needed to sustain its bid. The absence of a beat was enough to soften the greenback and unlock gold’s recovery. The Goods Trade Balance came in at -$85.0B, broadly in line with forecast and generating no independent dollar impulse. With the macro data clearing without incident, position-squaring and short-covering flows ahead of the weekly close amplified the move, pushing gold through $4,050 and into the $4,065 resistance zone that the morning analysis identified as the session’s extended target.
Updated Levels
- Current price: $4,060
- Bias now: Bullish — morning thesis confirmed; momentum has shifted structurally to the upside on the 15-minute chart
- Updated support: $4,045 → $4,028 → $4,007
- Updated resistance: $4,065 → $4,100 → $4,120
- NY session target: $4,080–$4,090 (conditional on $4,065 closing break before the weekly close)
Scenarios Into the Close
Bull: Price holds above $4,045 on any pullback and prints a 15-minute close above $4,065 → weekly close targets $4,080–$4,090, positioning gold for a constructive open on June 29.
Bear: Price fails to sustain above $4,065 and rolls back below $4,045 → consolidation between $4,028 and $4,050 into the close; the recovery thesis remains intact but Monday’s open becomes the next meaningful test.
Chart Analysis
The 15-minute XAU/USD chart as of 16:00 UTC+3 shows a clean impulsive structure off the $3,964 week low, with price now trading at $4,060 and pressing the $4,065.979 resistance level visible on the chart. The fast EMAs (green and orange) have turned sharply higher and are tracking price closely, while the slower blue EMA — still descending — has been left well below the current price, confirming the strength of the intraday recovery. Bollinger Bands have expanded upward, with price riding the upper band — a continuation signal in a momentum-driven move rather than a reversal warning at this stage. The $4,045 level, previously resistance, has flipped to support and was defended on the most recent intrabar pullback. The chart’s projected path arrow points toward $4,080–$4,090 following any brief consolidation at $4,065, with the $4,100 pink resistance band as the next significant structural ceiling. A clean weekly close above $4,065 would represent a meaningful technical development, shifting the near-term structure from corrective bounce to potential trend change on the short-term timeframe.
Analysis based on the XAU/USD 15-minute chart as of June 26, 2026, 08:37 UTC+3. This article is for informational and educational purposes only and does not constitute financial advice.