

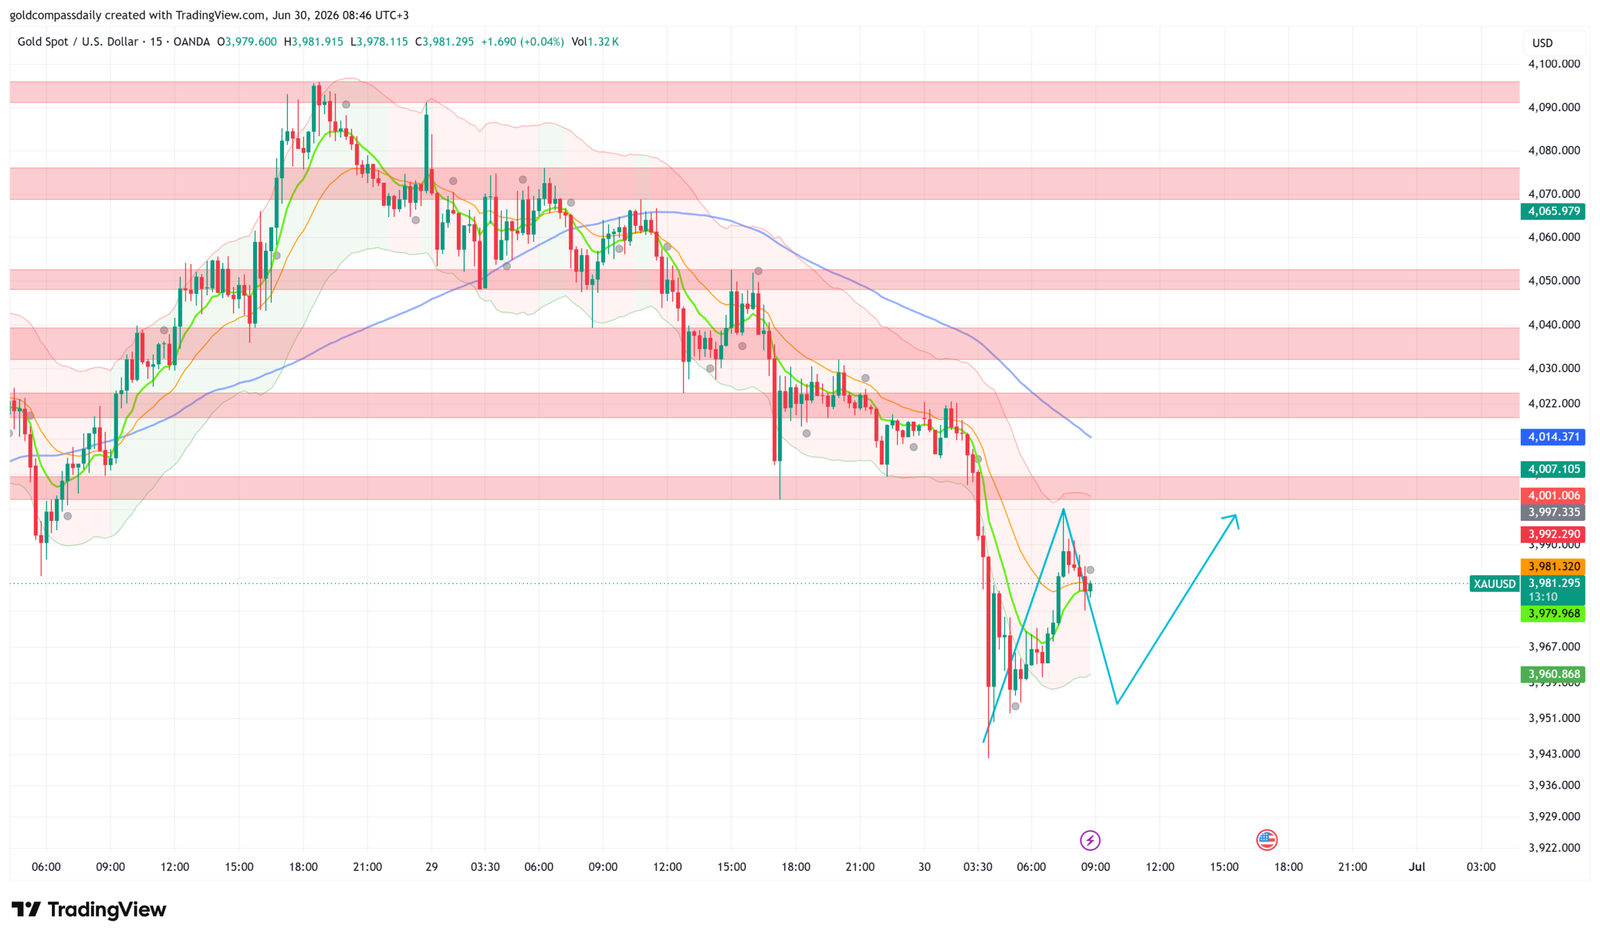
Gold trades bearish at $3,981 — the metal has broken decisively below the $4,000 psychological level after a sharp multi-session decline from the $4,100 high, and the current bounce toward $3,981–$3,990 looks corrective rather than structural.
Key Levels
- Bias: Bearish below $4,000
- Support: $3,960 → $3,940
- Resistance: $4,001 → $4,022 → $4,040
- Session target: $3,945 (conditional on a confirmed break below $3,960 on weak U.S. data)
- Invalidation: Above $4,022 = bearish structure neutralized, opens retest of $4,040
Catalyst of the Day
The priority event is the 5:00pm JOLTS Job Openings release alongside CB Consumer Confidence. JOLTS is forecast to soften to 7.28M from 7.62M, and a weaker print would normally support gold through rate-cut expectations — but with gold already in a confirmed downtrend and dollar demand dominant into month-end, a soft labor read is more likely to slow the selloff than reverse it outright. Watch 5:00pm UTC+3 for the JOLTS and Consumer Confidence prints together; a combined miss is the only scenario likely to produce a meaningful bounce attempt back toward $4,000.
Fundamental Context
Gold Compass Daily reports that the metal’s break below the $4,000–$4,058 channel floor referenced in yesterday’s session (XAU/USD Holds $4,058 Channel Floor, Targets $4,100 Resistance) has now failed, with sellers pressing price toward the $3,940–$3,960 zone. The move reflects renewed dollar strength into month-end and quarter-end flows, which typically pressure non-yielding assets like gold as institutional desks rebalance into cash and short-dated paper.
Tuesday’s calendar is dense but largely second-tier for gold ahead of the JOLTS release. Chinese Manufacturing and Non-Manufacturing PMI both came in at 50.3 and 50.2 respectively, modestly above the 50.0–49.9 forecasts — a marginally risk-positive signal that has not been enough to offset broader dollar demand. German and French inflation data due later in the session (Prelim CPI) carry limited direct relevance for gold but will shape EUR/USD positioning, which indirectly feeds into the dollar index gold tracks inversely.
The data shows this week’s broader macro setup, detailed in the Gold Week Ahead: NFP Week Tests Bounce From $4,007 Low hub article, centers on Friday’s Non-Farm Payrolls, with markets compressing positioning ahead of the print. U.S. markets close Friday, July 3 in observance of Independence Day, which falls on Saturday this year — a factor likely to thin liquidity into the NFP release and amplify intraday volatility.
Chart Analysis
The 15-minute chart shows gold in a confirmed downtrend, having fallen from the $4,100 high through a series of lower highs and lower lows to a session low near $3,945 before stabilizing. Price is currently consolidating in a tight ascending channel between $3,960 and $3,990, with the short-term moving averages (green and orange) curling higher inside the bounce but remaining well below the longer blue moving average, which continues sloping downward — a structure consistent with a corrective retracement inside a larger bearish trend rather than a reversal. The $4,001–$4,007 zone, which previously acted as support through late June, has flipped into the nearest overhead resistance, and a clean reclaim of that zone would be required before the bullish case gains traction. Failure to clear $4,001 keeps the path of least resistance pointed back toward the $3,960 and $3,940 support shelf.
Bull / Bear Scenarios
Bull trigger: Confirmed close above $4,001 with JOLTS/Confidence misses → targets $4,022, then $4,040.
Bear trigger: Rejection at $3,990–$4,001 followed by a break of $3,960 → targets $3,945, then $3,940.
Events Ahead
- Tue 4:00pm — USD HPI m/m and S&P/CS Composite-20 HPI y/y: housing data, secondary relevance, watched for broader consumer health signals.
- Tue 4:45pm — USD Chicago PMI (55.7 forecast vs 62.7 prior): a steep miss would reinforce slowdown fears and could cap dollar strength temporarily.
- Tue 5:00pm — USD CB Consumer Confidence and JOLTS Job Openings: today’s primary gold catalyst; weak prints support a near-term bounce, strong prints extend the bearish move.
- Tue 11:30pm — USD API Weekly Statistical Bulletin: indirect dollar/risk-sentiment driver via energy markets.
- Fri Jul 3 — Non-Farm Payrolls (U.S. markets closed in observance of July 4, which falls Saturday): the week’s dominant catalyst, detailed in the Gold Week Ahead hub article.
Gold Compass Daily maintains a bearish bias on XAU/USD while price holds below $4,000, with the $3,960–$3,940 zone the next downside objective barring a sharp dollar reversal on today’s JOLTS and Consumer Confidence data.
New York Session Update
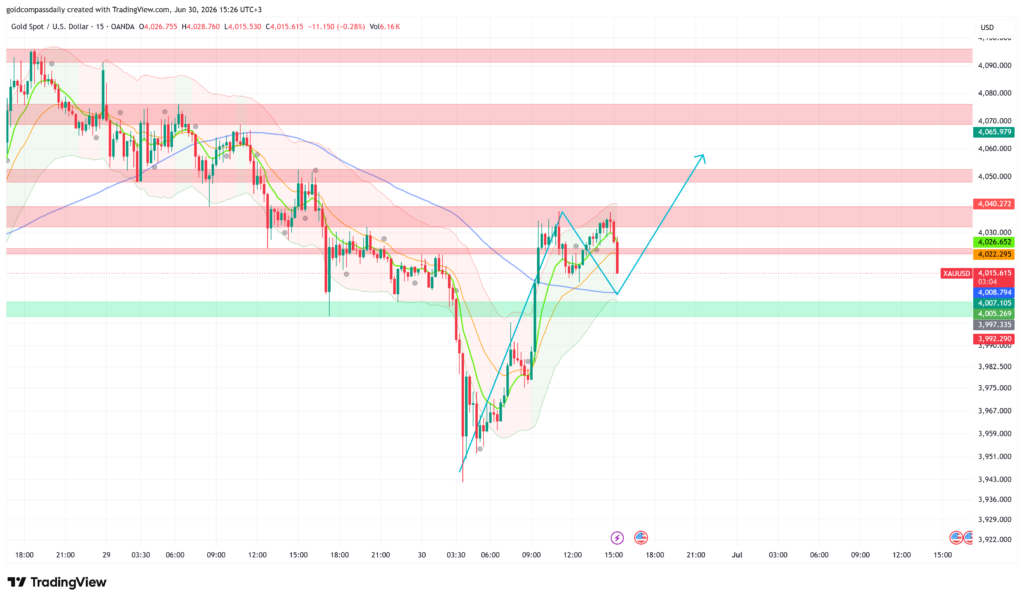
Gold trades at $4,015, recovering sharply from the overnight low near $3,945 and reclaiming the $4,000 psychological level. Gold Compass Daily’s morning analysis flagged the $3,940–$3,960 zone as the key downside target, and that level held as a floor — price has since staged a strong rebound, validating the buy-side setup on the bounce.
What Changed
Since the morning update, gold swept down to $3,945 before buyers stepped in aggressively, driving a sharp rally through $3,990 and back above the $4,000 mark. The move accelerated into the New York session, with price pushing through the $4,007–$4,022 resistance band that capped earlier attempts. The recovery reflects a combination of short-covering after the capitulation low and renewed dip-buying interest once the $3,940 support zone proved defended, with U.S. data releases through the afternoon failing to derail the bounce.
Updated Levels
- Current price: $4,015
- Bias now: Bullish above $4,000 — morning downside target at $3,940–$3,960 was reached and held, shifting the near-term picture toward recovery
- Updated support: $4,005 → $3,997
- Updated resistance: $4,022 → $4,040
- NY session target: $4,040 (conditional on a sustained close above $4,022)
Scenarios Into the Close
Bull: Confirmed hold above $4,005 → targets $4,022, then $4,040. Bear: Rejection at $4,022 with a break back below $4,005 → retest of $3,997.
Chart Analysis
The 15-minute chart shows a sharp V-shaped reversal off the $3,945 low, with price now consolidating between $4,005 and $4,040 after reclaiming the short-term moving averages. The green and orange moving averages have crossed back above price’s prior support and are curling higher, while the longer blue moving average is flattening near $4,008–$4,015, acting as a pivot rather than resistance for the first time since the breakdown began. The $4,022–$4,040 band remains the key overhead supply zone visible on the chart, having previously triggered the original selloff, and a clean break above it would confirm the shift from corrective bounce to a more durable recovery. Structure favors continuation toward $4,040 as long as the $4,005–$3,997 zone holds as a floor on any pullback.
Analysis based on the XAU/USD 15-minute chart as of June 30, 2026, 08:46 UTC+3. This article is for informational and educational purposes only and does not constitute financial advice.