
The precious metals market has just navigated one of its most turbulent 48-hour periods in recent history. This Gold multi-timeframe analysis provides a holistic view of the current XAU/USD structure following the massive rejection at the $5,600 psychological peak. By synchronizing the signals from the 5-minute, 1-hour, and 4-hour charts, we aim to provide a roadmap for traders looking to navigate the post-crash environment on February 2, 2026.


The Macro View: 4-Hour Structure and Major Support
When performing a Gold multi-timeframe analysis, we must always start with the higher timeframe to establish the primary trend. The 4-hour chart remains the most critical for identifying institutional levels. Currently, the price is battling to hold the $4,780 support zone—a level that has historically served as a base for buyers.
The “Warsh Shock”—triggered by the nomination of Kevin Warsh as Fed Chair—has sent a jolt through the yields, forcing a broad-based liquidation in gold. However, the 4H chart shows that while the parabolic move is over, the fundamental bull case is being tested at these lower levels. For a deep dive into the long-term support zones and Fibonacci levels, read our full Gold 4H Chart Analysis here.
Intermediate Momentum: The 1-Hour Recovery Signals
Moving down to the intermediate timeframe, our Gold multi-timeframe analysis shifts focus to the battle for momentum. The 1-hour chart is currently showing a “V-bottom” attempt as price recovers from the initial panic lows. We are seeing a cluster of hourly moving averages acting as a ceiling near $4,850.
Traders are closely watching whether XAU/USD can convert the previous resistance into support. This timeframe is essential for swing traders who need to see a confirmed shift in the RSI before committing to a larger position. You can find the specific breakout targets and hourly supply zones in our Gold 1H Chart Technical Analysis.
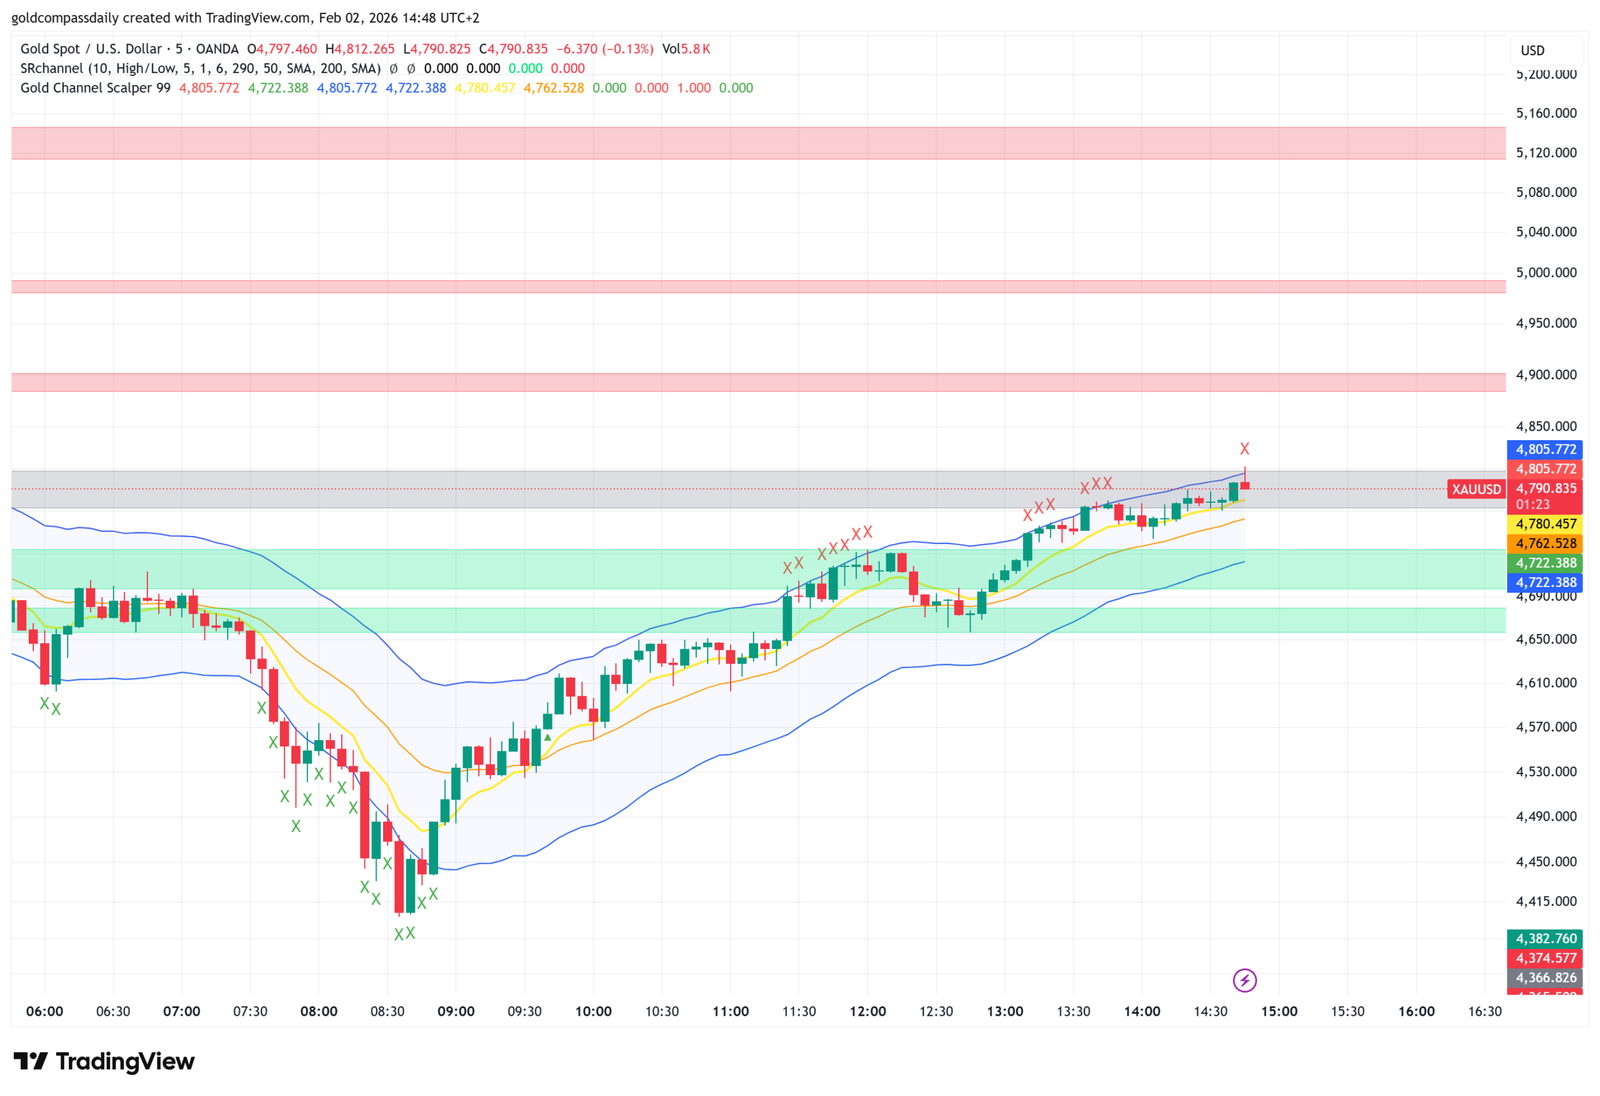
Intraday Precision: The 5-Minute Scalping Channel
For those who thrive on volatility, the lower timeframe offers the most immediate opportunities. In this Gold multi-timeframe analysis, the 5-minute chart shows a surprisingly stable bullish channel that formed during the European session. Despite the carnage on the daily charts, the intraday trend has been consistently making higher highs.
Scalpers are using these micro-moves to capitalize on the mean-reversion toward the $4,800 level. This “grind higher” suggests that the immediate selling pressure has exhausted itself, at least until the US session brings a fresh wave of volume. For a detailed look at the 5M channel signals and stop-loss placements, check our Gold 5M Chart Scalping Analysis.
Synthesis: How to Trade the Convergence
The true power of a Gold multi-timeframe analysis lies in the convergence of these signals. Here is the current strategic summary for February 2, 2026:
- The Bullish Case: If the 5M bullish channel holds and the 1H chart reclaims $4,850, we expect a relief rally toward the $5,000 psychological level.
- The Bearish Case: If the 4H support at $4,710 fails to hold, the intraday recovery will likely be wiped out, opening the door for a drop toward the $4,400 liquidity zone.
The nomination of Kevin Warsh remains the primary fundamental driver, but technical levels are now dictating the pace of the recovery. The CME Group’s hike in margin requirements for precious metals has cleared out much of the retail leverage, potentially creating a “cleaner” environment for institutional buyers to step back in.
Conclusion: Stay Disciplined
The February crash from $5,600 has been a wake-up call for many. As this Gold multi-timeframe analysis demonstrates, the market is currently in a “healing” phase. While the 5-minute chart offers scalping opportunities and the 1-hour chart shows recovery signs, the 4-hour chart warns that we are not yet out of the woods.
Risk management is paramount. Ensure your stop-losses are aligned with the timeframe you are trading, and never let a lower-timeframe scalp turn into a higher-timeframe losing investment. Stay tuned to Gold Compass Daily as we continue to track the XAU/USD recovery through every tick and every timeframe.