
Gold Price Analysis 2026: A Top-Down View of the $5,000 Rebound
The first week of February 2026 has been a “baptism by fire” for precious metals. Following a record high near $5,602, gold suffered its steepest one-day drop since 1983, plummeting nearly 10%. However, as of February 4, 2026, the narrative has shifted from panic to profit. Gold has surged over 6% to reclaim the psychological $5,000 level. This Gold Price Analysis 2026 provides a comprehensive top-down look at why the bulls are charging back.
1. Macro Perspective: The “Warsh Shock” and Trade Thaw
The sudden volatility was triggered by a “perfect storm”: the nomination of hawkish Kevin Warsh as Fed Chair and a subsequent margin-call rout that flushed out “weak hands”. Despite this, the structural bull case remains. J.P. Morgan recently upgraded their year-end Gold Price Analysis 2026 forecast to $6,300, citing massive central bank diversification into real assets. Furthermore, a landmark US-India trade deal has eased energy purchase restrictions, providing a tailwind for broader global growth.
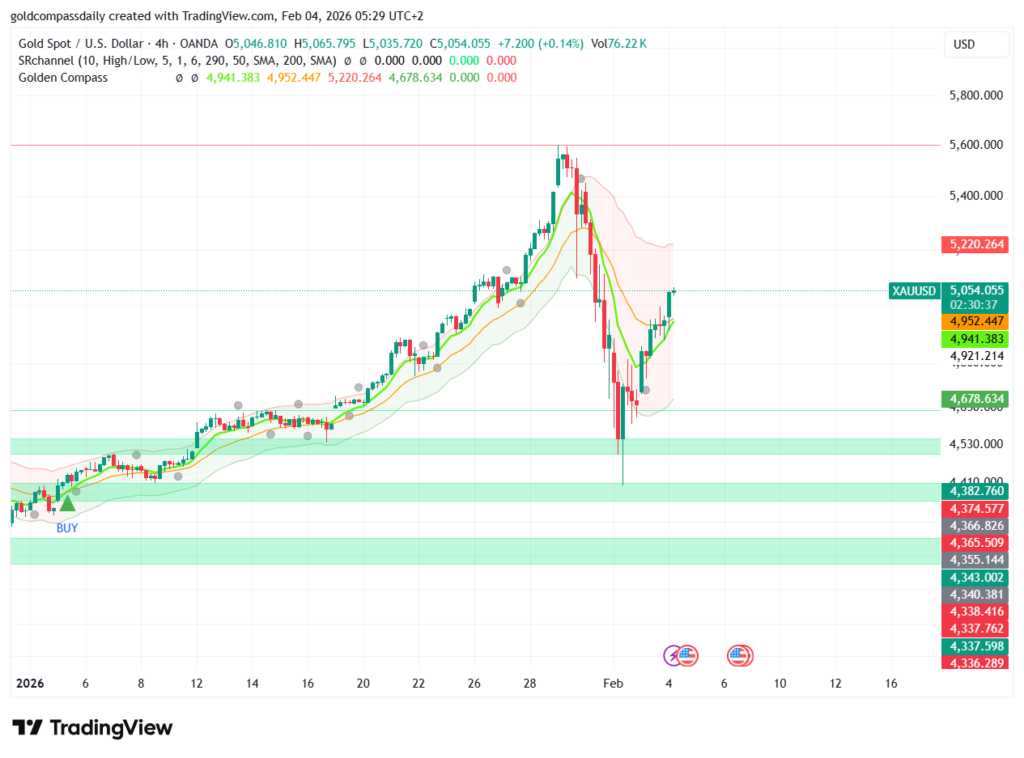
2. 4-Hour Analysis: Testing the “Line in the Sand”
On the 4-hour (H4) chart, gold is currently testing the 50-day EMA near $5,050. This “V-shaped” recovery is aggressive, but traders must watch for a potential “dead-cat bounce” if prices stay below the golden pocket at $5,200.
- Support: The $4,400 zone has established itself as the “dip of the decade” support level.
- Resistance: A breakout above the $5,153 – $5,208 zone is required to confirm that the correction is over.
Read more on the H4 strategy: Is the $5,000 Comeback for Real?
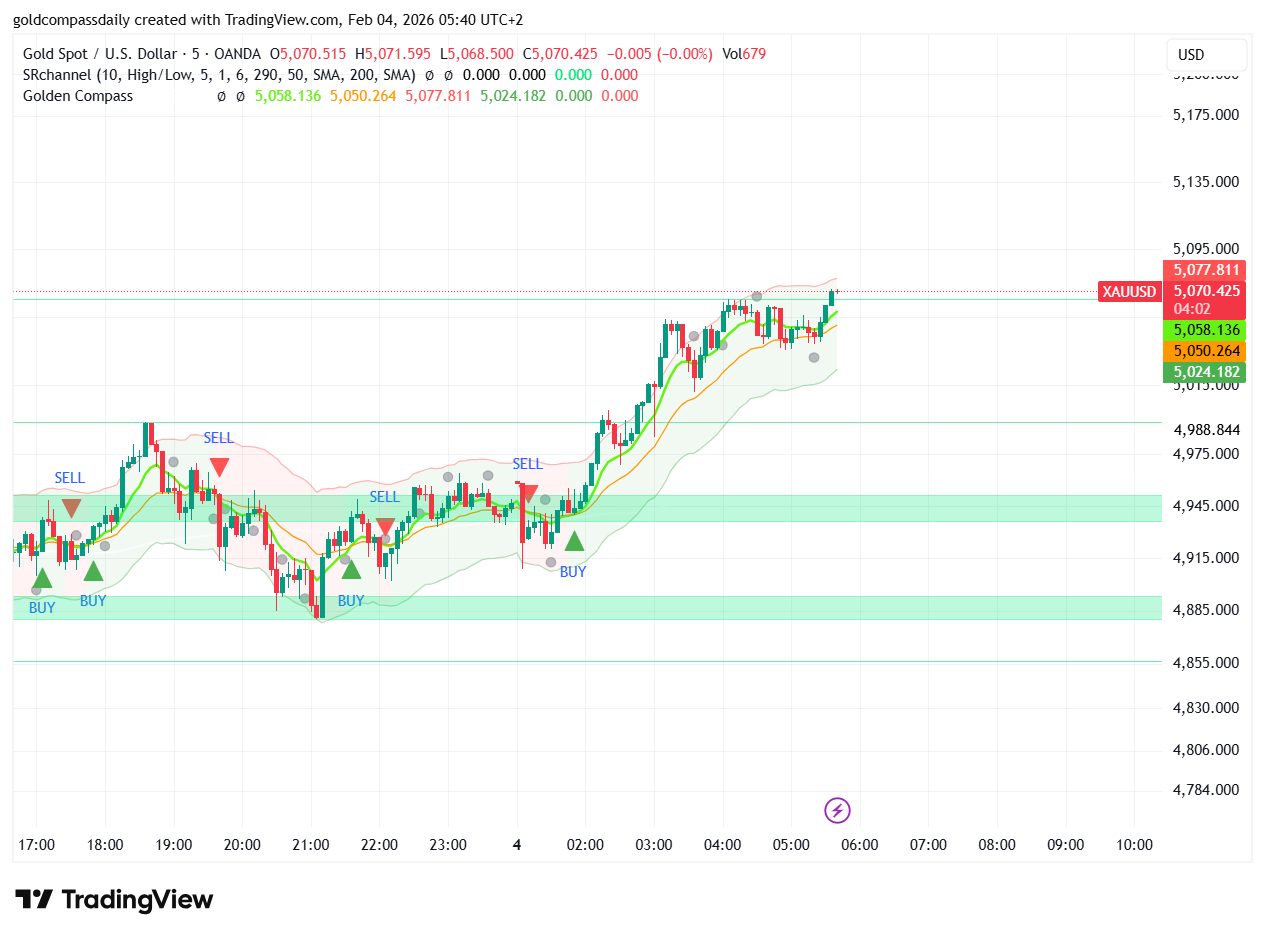
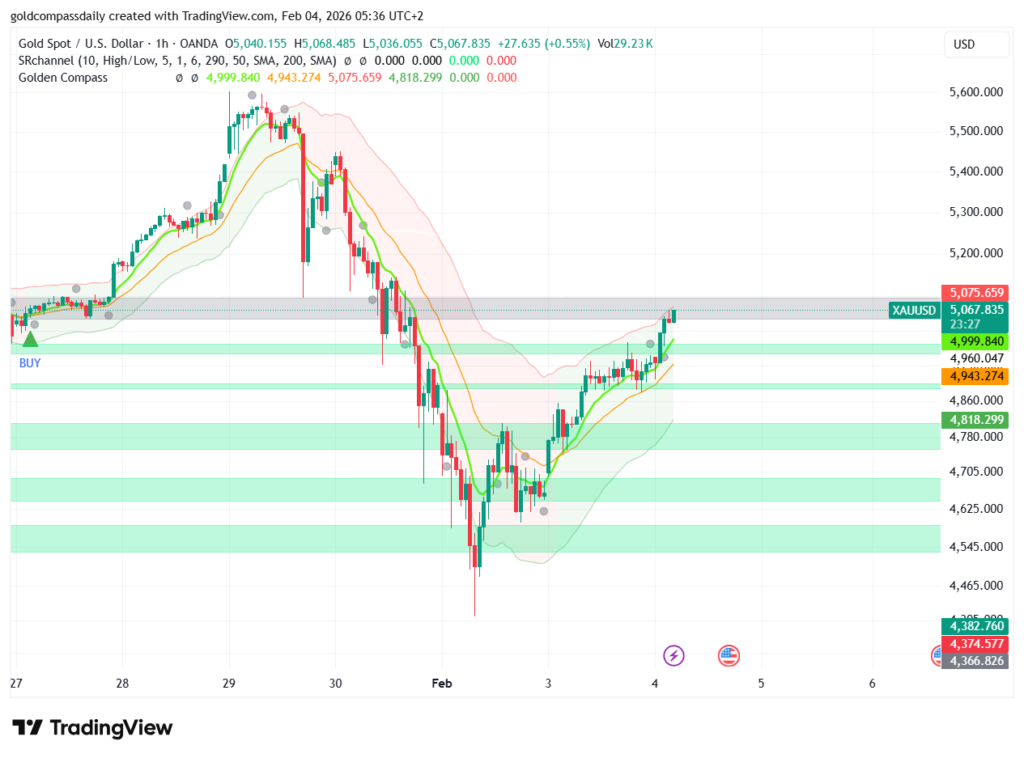
3. 1-Hour & 5-Minute Analysis: Scalping the Surge
The intraday charts show a rapid mean-reversion move. On the 1-hour (H1) timeframe, gold has formed a bullish Marubozu, signaling intense buying pressure between $4,701 and $4,821. Scalpers on the 5-minute (m5) timeframe are using the $4,950 level as a pivot for “Buy the Dip” entries toward $5,050.
- Intraday Pivot: $4,930 remains the key intraday floor.
- Short-term RSI: Currently near 52, suggesting momentum is stabilizing but not yet overbought on the higher timeframes.
Deep dive into short-term levels: The $5,000 Rebound Is Underway and The $5,000 Battle & Trade Strategy.
Conclusion: The Bull Run Resumes
Today’s Gold Price Analysis 2026 reveals a market that has undergone a violent but healthy reset. While the $6,300 targets from major banks like J.P. Morgan and Deutsche Bank remain ambitious, the rapid reclamation of $5,000 proves that gold’s safe-haven appeal is far from dead. In a world of extreme volatility, gold continues to be the “ultimate insurance policy.”