

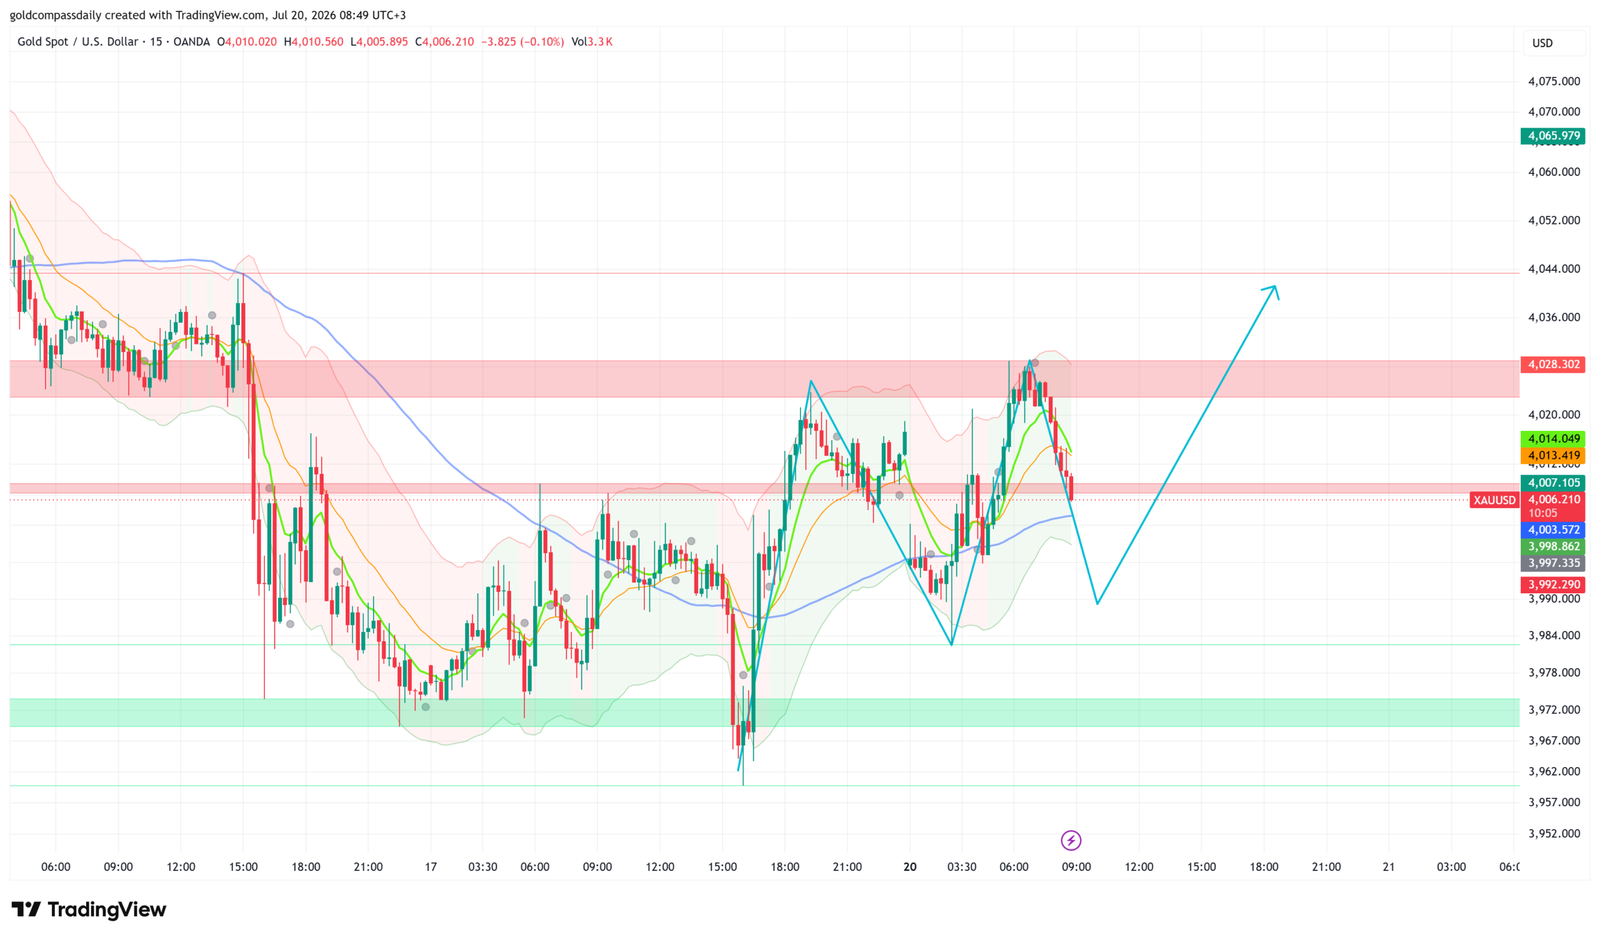
Gold trades cautiously bullish at $4,006 — consolidating inside a $3,980–$4,028 range as China’s unchanged Loan Prime Rates remove a dovish catalyst and attention shifts to Canadian CPI and the CB Leading Index for directional confirmation. The 15-minute chart shows price pulling back from the $4,028 resistance ceiling after a failed breakout attempt in the Asian session, with the projected path on the chart suggesting a retest of the $3,984–$3,992 demand zone before any renewed push toward $4,044. Monday’s bias is hold.
Key Levels
- Bias: Cautiously Bullish above $3,992
- Support: $3,998–$4,003 → $3,984–$3,992 (demand zone)
- Resistance: $4,028 (channel ceiling) → $4,044 → $4,065
- Session target: $4,044 (conditional on sustained break above $4,028 with volume)
- Invalidation: Below $3,980 = channel structure breaks, exposes $3,963–$3,972 gap fill
Catalyst of the Day
Canadian CPI at 3:30 PM UTC+3 is the primary macro event of the Monday session. The headline m/m reading carries a forecast of –0.2% against a prior of 1.0% — a sharp deceleration that, if confirmed, would raise Bank of Canada rate cut expectations and apply modest USD-supportive pressure via CAD weakness. However, the more consequential read for gold lies in the core measures: Trimmed CPI (forecast 2.0%) and Median CPI (forecast 2.1%) will determine whether disinflation is broadening across North America. A softening core print reintroduces the global easing narrative that has anchored gold’s recovery above $3,980 since Friday. Watch for any upside surprise in core CPI, which could trigger a temporary dollar bid and test gold’s $3,998–$4,003 support cluster.
Fundamental Context
China’s People’s Bank held both the one-year and five-year Loan Prime Rates unchanged at 3.00% and 3.50% respectively, in line with consensus. The decision removes a potential stimulus catalyst that markets had partially speculated on following recent weakness in Chinese economic data. For gold, unchanged Chinese rates mean no fresh demand impulse from the world’s largest physical gold market — a mild headwind to near-term upside momentum. Chinese Foreign Direct Investment data remains in negative territory on a year-to-date basis (prior: –8.6%), reinforcing the softening domestic growth backdrop but stopping short of triggering a panic-driven safe-haven surge.
The broader macro context remains constructive for gold. Japan’s banking holiday reduces yen liquidity and limits JPY-cross volatility, keeping risk sentiment subdued during the Asian session. New Zealand’s Trade Balance came in at 23 million against a prior of 577 million — a significant deterioration that pressured NZD and kept commodity-linked currency appetite in check. German PPI printed at –0.2% month-on-month against a 0.3% forecast, extending the Eurozone disinflation trend and adding to the case for continued European Central Bank easing — a development that historically correlates with gold accumulation by European institutional players seeking real asset hedges. The ECB decision later this week remains the dominant macro event for the full session range.
Chart Analysis
The 15-minute XAU/USD chart as of 08:49 UTC+3 on July 20 shows price at $4,006.21, trading inside a defined channel between the $3,972 green demand band and the $4,028 red resistance band. Price mounted a sharp recovery from the $3,963 intraday low printed around the July 17 early Asian session, rallying to test $4,028 resistance twice — with both attempts producing wicks and no sustained close above the level. The most recent candle sequence shows a pullback from the $4,028 ceiling toward $4,003–$4,007, where the fast moving averages (green and orange) are converging and providing dynamic support. The blue slow moving average remains below price, confirming the short-term recovery structure is intact. The projected path annotated on the chart anticipates a dip toward $3,984–$3,992 before a resumed push toward $4,044 — a sequence consistent with a bull flag compression. Bollinger Band width is contracting, suggesting a directional move is approaching. The $4,007 dotted horizontal level represents the current equilibrium pivot; price needs to hold above this level on any pullback to keep the bullish scenario structurally valid.
Bull / Bear Scenarios
Bull Trigger
Price holds $3,998–$4,003 on the anticipated pullback and produces a 15-minute close back above $4,013 with expanding volume → target $4,028 retest, then $4,044 on a clean break. Canadian CPI core misses to the downside (Trimmed below 1.9%) accelerates the move.
Bear Trigger
Price closes below $3,992 on the 15-minute chart and fails to reclaim intraday → exposure to $3,984, then $3,972 channel floor. A break of $3,980 on a closing basis negates the recovery structure and opens the July 17 gap zone toward $3,963.
Events Ahead
- Mon Jul 20, 3:30 PM UTC+3 — Canadian CPI m/m (forecast –0.2%): Disinflation read across core measures could revive global easing narrative and support gold above $4,000.
- Mon Jul 20, 5:00 PM UTC+3 — CB Leading Index m/m (forecast –0.1%): A consecutive negative reading signals US slowdown risk — historically a soft gold support at the margin.
- Thu Jul 24 — ECB Rate Decision: Dominant event risk for the week. A 25 bp cut reinforces Eurozone easing, supporting gold’s safe-haven and real-asset demand. See the weekly hub for full event calendar.
- Thu Jul 24 — Global Flash PMIs: Manufacturing and services readings across US, EU, and UK will define risk appetite and dollar direction into the week’s close.
With price oscillating inside the $3,980–$4,028 channel and no high-impact USD catalyst until the afternoon session, the operative stance for Monday’s European open is to monitor the $4,003–$4,007 pivot cluster. A clean hold and reclaim of $4,013 confirms the bull path toward $4,044; a close below $3,992 shifts the near-term focus to channel floor support at $3,972. Friday’s session analysis is available here.
New York Session Update
Price Check
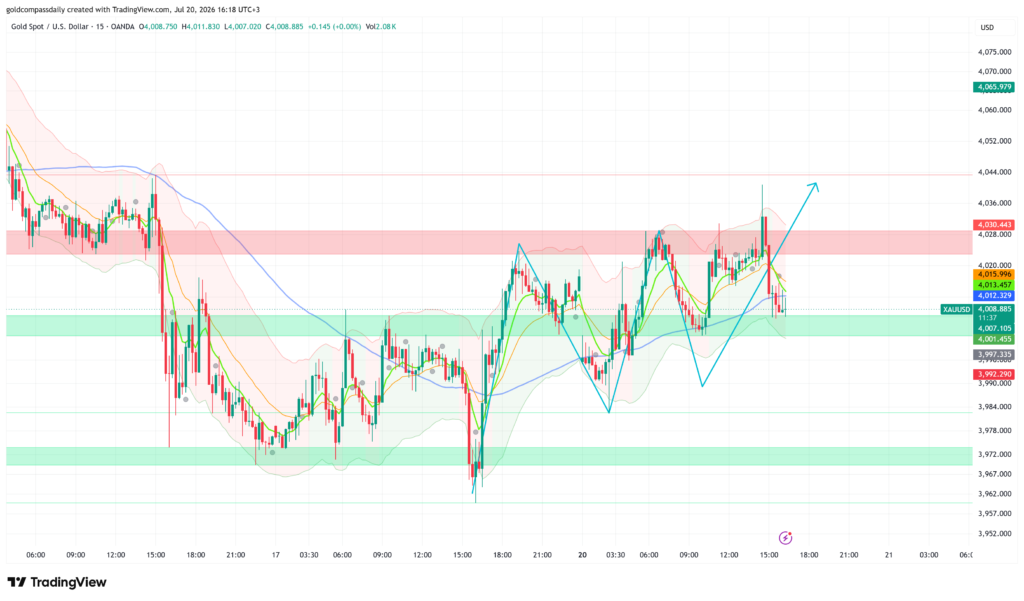
Gold trades at $4,008.89 as New York liquidity enters, holding above the $4,007 pivot that the morning analysis identified as the line between continuation and failure. The cautiously bullish hold bias from the morning session remains intact — price never tested the projected $3,984–$3,992 dip zone and instead ground higher through the European session.
What Changed
Canadian CPI delivered a mixed outcome. The headline m/m print came in softer than the already-weak forecast, while core measures — Trimmed CPI and Median CPI — held broadly near consensus, removing a clean catalyst in either direction. The absence of a sharp core upside surprise kept the dollar bid contained, allowing gold to extend the morning’s grinding recovery. More consequentially, price broke and closed above the $4,028 red resistance band during the early New York approach, tagging a session high of $4,030.44 before pulling back to retest $4,008–$4,013 — a zone that now flips to support. The breakout, while not yet confirmed on a sustained closing basis, shifts the intraday structure from consolidation to tentative breakout.
Updated Levels
- Current price: $4,008.89
- Bias now: Cautiously Bullish — unchanged, but structure improved following the $4,028 breach
- Updated support: $4,007–$4,012 (former resistance, now pivot) → $4,001
- Updated resistance: $4,030–$4,044 (next ceiling)
- NY session target: $4,044 on a 15-minute close above $4,030 with volume
Scenarios Into the Close
Bull: Price holds $4,007–$4,012 on the current retest and prints a 15-minute close back above $4,016 → reloads the $4,030 breakout attempt and opens $4,044 into the close. Bear: Failure to hold $4,007 on a closing basis pulls price back into the $3,998–$4,003 range and delays the breakout scenario until Tuesday’s session.
Chart Analysis
The 15-minute chart as of 16:18 UTC+3 shows a clear structural improvement from the morning snapshot. Price rallied from the $4,007 equilibrium pivot, broke above the $4,028 red resistance band, and printed a high of $4,030.44 before pulling back to the current $4,008 area. The fast moving averages (green and orange) have crossed bullishly and are now aligned above the slower blue average — the first clean bullish MA stack visible since the July 17 selloff. The projected path on the chart mirrors the morning annotation: a shallow retest of the $4,008–$4,012 zone followed by a continuation leg toward $4,044. The $4,001 level marked on the right panel represents the next meaningful demand reference if the retest deepens. Bollinger Bands have expanded modestly on the breakout candle, confirming directional momentum behind the move. The $4,065 level remains the chart’s upper reference point and represents the full bull extension if $4,044 is cleared.
Analysis based on the XAU/USD 15-minute chart as of July 20, 2026, 08:49 UTC+3. This article is for informational and educational purposes only and does not constitute financial advice.
Market Close Update — Looking Ahead to July 21
How Monday Closed
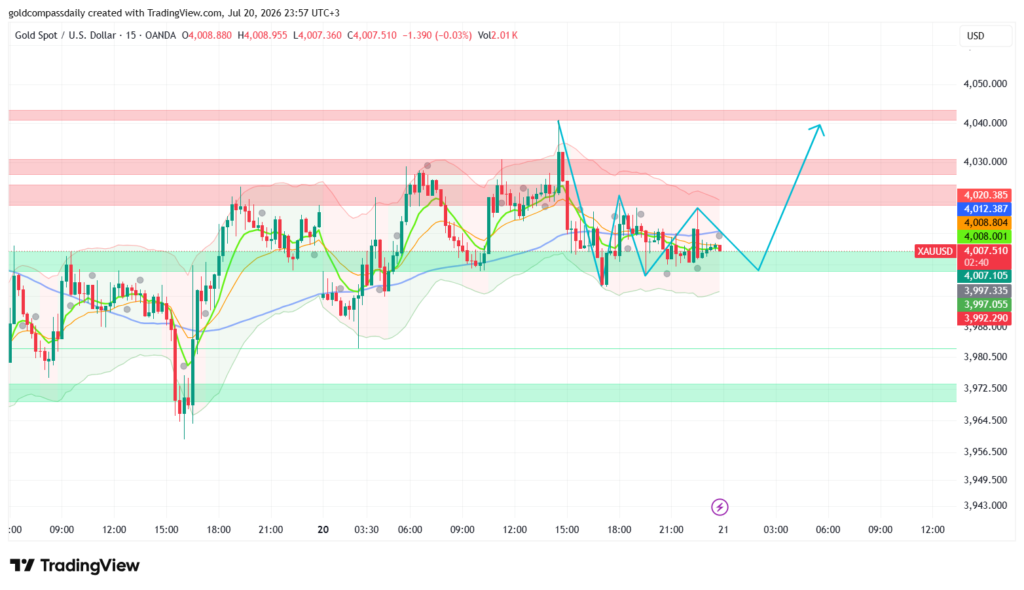
Gold settled at $4,007.51 as New York closed, ending the session almost exactly where it opened — a tight range day that confirmed the channel thesis from the morning analysis. The $4,028–$4,030 resistance ceiling held across three separate intraday attempts, with the session high of $4,030.44 printed during early New York trade before sellers reasserted. Price then ground back toward the $4,007–$4,008 equilibrium pivot and stalled there into the close, well above the $3,980 invalidation level. Monday’s hold bias proved correct.
What the Close Tells Us
Three tests of $4,028–$4,030 without a sustained close above that band is a technically significant signal — the resistance is real and defended. At the same time, the $3,997–$4,008 support cluster absorbed every pullback attempt through the afternoon session, with price never threatening the $3,992 bear trigger identified in the NY update. The result is a compression structure entering Tuesday: Bollinger Bands on the 15-minute chart have narrowed markedly into the close, the three moving averages (green, orange, blue) are converging toward $4,007–$4,013, and volume has stepped down to 2.01K — the lowest of the session. Compressed volatility after a multi-test resistance rejection typically precedes a directional resolution within the first 1–3 hours of the next session.
Updated Levels Into Tuesday
- Close price: $4,007.51
- Bias: Cautiously Bullish — intact but contingent on holding $3,997
- Key support: $4,007–$4,008 (immediate) → $3,997–$3,998 → $3,992
- Key resistance: $4,020 → $4,028–$4,030 (triple-tested ceiling) → $4,040–$4,044
- Bull target Tuesday: $4,040–$4,044 on a clean 15-minute close above $4,030
- Invalidation: Close below $3,992 reopens $3,972 channel floor
What to Watch Tuesday, July 21
No major tier-1 USD data is scheduled for Tuesday, which shifts the focus to two factors: carry-over momentum from Monday’s compression resolution, and any commentary from Fed officials or geopolitical headlines that could move the dollar independently of scheduled data. The chart’s projected path into Tuesday anticipates a shallow early dip toward the $3,988–$3,992 zone — potentially during the Asian or early European session — before a renewed attempt at $4,028–$4,030. A clean break and close above that ceiling on expanded volume would be the first genuine structural confirmation that the recovery from the July 17 low at $3,963 has legs toward $4,044 and the weekly hub target of $4,137–$4,150. The ECB decision and flash PMIs on Thursday remain the dominant macro events for the week — Tuesday’s price action will largely set the approach structure into that risk event.
Bull trigger Tuesday: Hold $4,007 at the Asian open, reclaim $4,020 early Europe → fourth attempt at $4,028–$4,030 with a confirmed close above → $4,044 opens.
Bear trigger Tuesday: Failure of $3,997 on a closing basis during Asia → $3,992 test, then $3,972 channel floor if sellers accelerate.
Update based on the XAU/USD 15-minute chart as of 23:57 UTC+3, July 20, 2026. This article is for informational and educational purposes only and does not constitute financial advice.